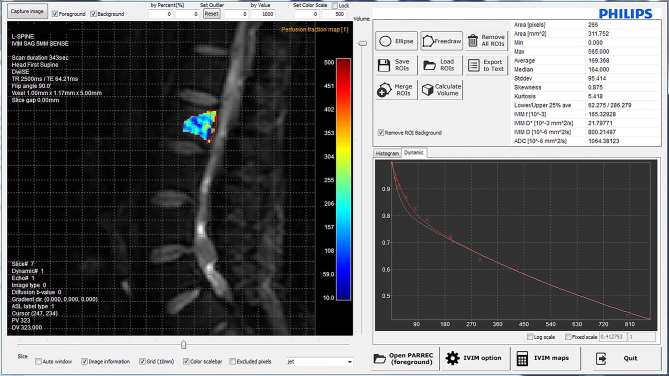
Figure 2.
Graphical user interface of the IVIM analysis software. The ROI was positioned on diffusion-weighted MR images (b0 images) using in-house IVIM analysis software that automatically calculates IVIM-derived parameters. The graph shows the IVIM signal decay curves of the ROI at the L2 vertebral body. IVIM, intravoxel incoherent motion; ROI, region of interest; TE, echo time; TR, repetition time.

