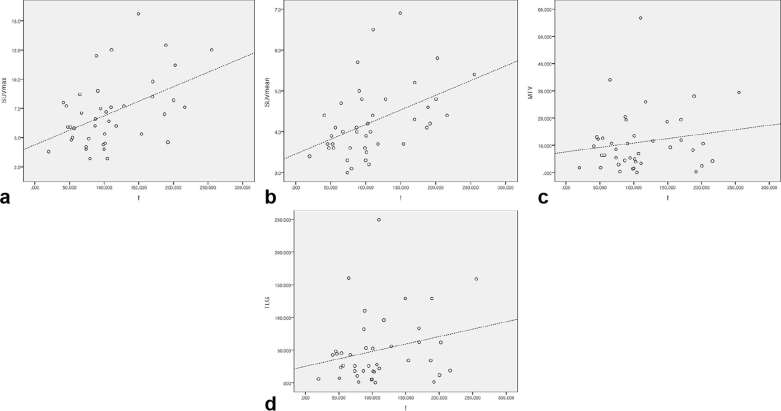
Figure 3.
Scatterplots of the correlation between the perfusion fraction and 18F-FDG PET metabolic parameters. (a–d) Graphs show the results of the correlation analysis among the f and SUVmax (a), SUVmean (b), MTV (c), and TLG (d). Dashed lines represent the trend in each graph. f, perfusion fraction; MTV, metabolic tumor volume; SUVmax, maximum standardized uptake value; SUVmean, mean SUV; TLG, total lesion glycolysis.

