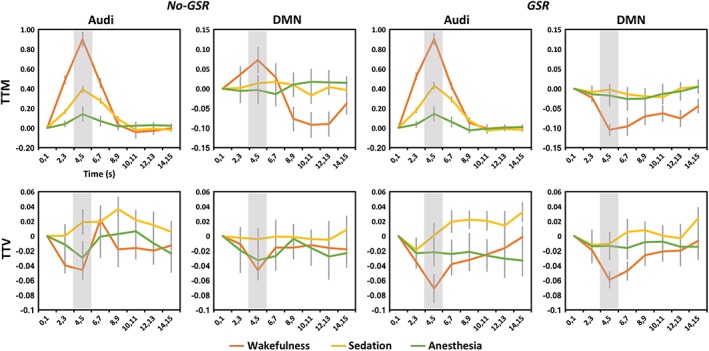
Figure 3.

Time courses of average and variability of stimulus‐induced activity across trials within the time window after stimulus presentation (0–15 s). The results are shown for the auditory cortex (Audi) and default‐mode network (DMN). Shaded areas indicate the peak period (4–5 s) of stimulus‐induced activity, where trial‐to‐trial mean (TTM) and trial‐to‐trial variability (TTV) were calculated. Results without and with global signal regression (no‐GSR and GSR) are shown. Error bars indicate ±SEM [Color figure can be viewed at http://wileyonlinelibrary.com]
