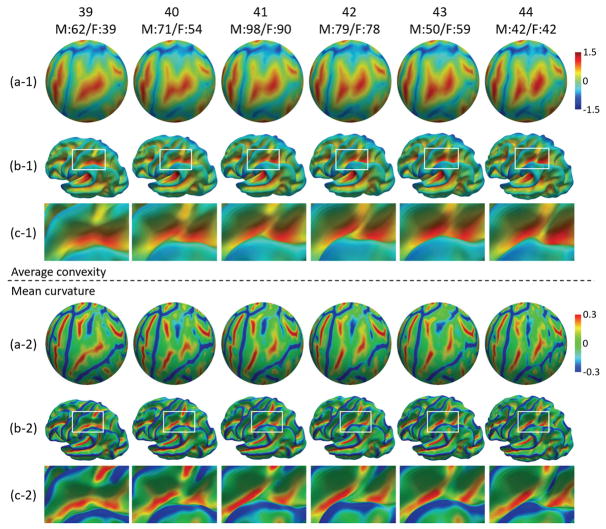
Fig. 1.
The constructed spatiotemporal neonatal cortical surface atlases from 39 to 44 weeks. (a-1) and (a-2) show the color-coded average convexity and mean curvature on the spherical surfaces, respectively. (b-1) and (b-2) show the color coded average convexity and mean curvature on the averaged inner surfaces. (c-1) and (c-2) zoom a respective region for better inspection of the folding development.

