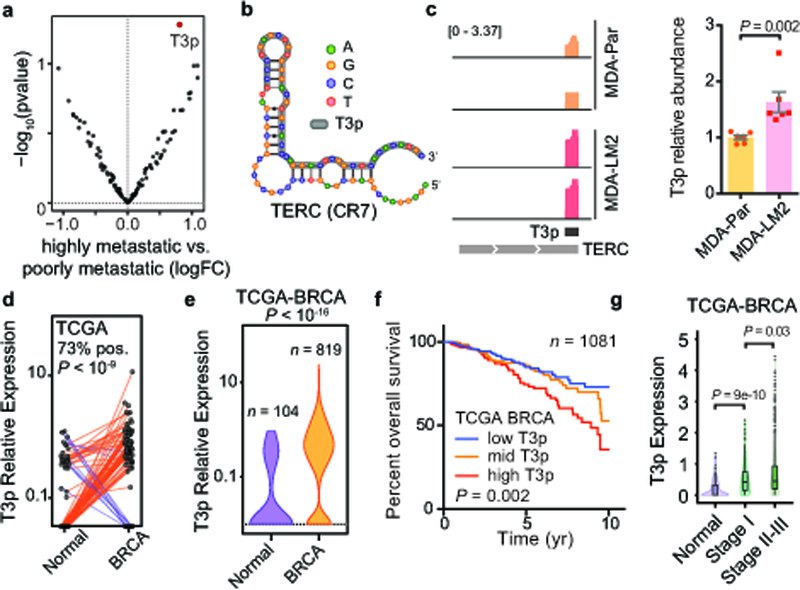
Fig 2: The oncRNA T3p is associated with breast cancer progression.

a, A volcano plot comparing the expression of oncRNAs in poorly metastatic breast cancer cells relative to their highly metastatic derivatives. T3p is highlighted in red. n = 4 biologically independent experimental comparisons. P values and log fold change were calculated using the DE-seq2 package (two-sided, no correction for multiple testing). b, T3p (in grey) maps to the 3’ end (CR7 domain) of TERC, the RNA component of telomerase. c, Normalized (per million reads mapped) coverage plots for reads mapped to TERC in smRNA-seq data from highly metastatic MDA-LM2 cells and poorly metastatic MDA-MB-231 parental cells in our previously published data18 (identical y-axes), and validation of this T3p upregulation by qRT-PCR (n = 6, comprised of two biologically independent sets of biologically independent triplicates, using a two-tailed Mann-Whitney test). Shown are mean ± s.e.m. d, Expression of T3p (count-per-million; cpm) in breast tumor biopsies and their matched normal tissue in the TCGA-BRCA dataset. n = 96 biologically independent paired samples. A paired two-way Wilcoxon test was used to calculate the associated P-value. e, Violin plots of T3p expression across the TCGA-BRCA dataset. n = 923 biologically independent samples. A two-way Mann-Whitney test was used to calculate the P value. Violin plots show the distribution along the minima and maxima for each cohort (median = 0 for normal and 0.34 for BRCA). f, Survival analysis in the TCGA-BRCA dataset for patients stratified into tertiles based on the expression of T3p in their tumors. All tertiles are shown. P value calculated from a two-sided log-rank test. Hazard-ratio (HR) equals 0.5 for the low vs. high tertiles. g, Expression of T3p across normal, stage I, and stage II and III samples in the TCGA-BRCA dataset shown as violin and boxplots (quartiles). Normal: n = 104 (median = 0), Stage I: n = 169 (median = 0.42), Stage II-III: n = 799 (median = 0.46). The violin plots show the distribution along the minima and maxima. The boxplots show the quartiles. The whiskers indicate quartile ± IQR (inter-quartile range). Outliers are also shown as points. P value calculated using a two-way Mann-Whitney test.
