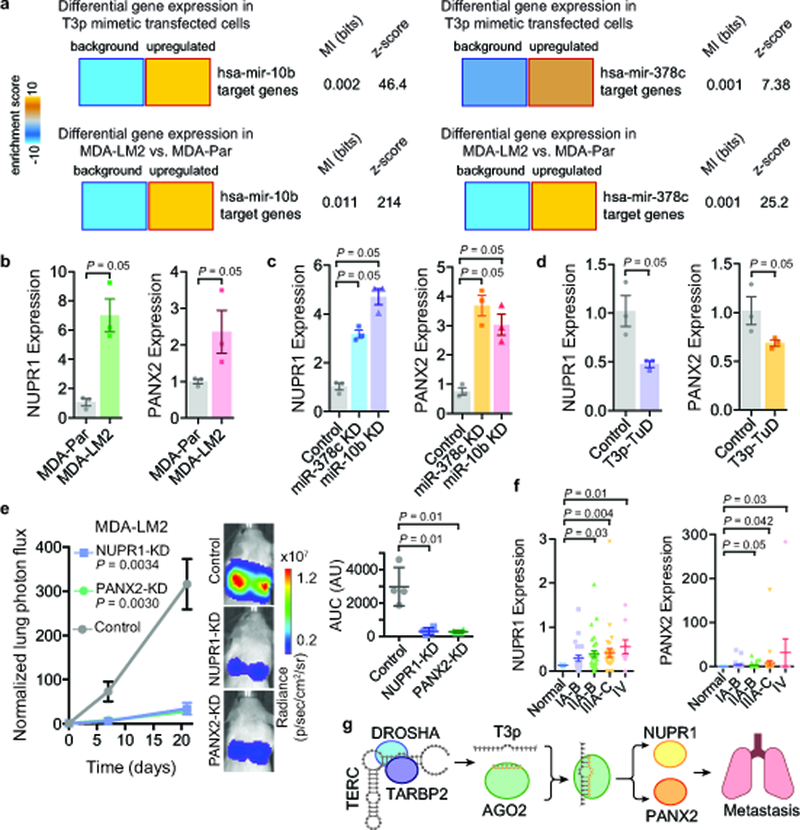
Fig 5: T3p-mediated inhibition of miR-10b and miR-378c results in overexpression of metastasis promoters NUPR1 and PANX2.

a, Heatmaps showing significant upregulation of miR-10b and miR-378c targets upon transfection of MDA-MB-231 cells with T3p mimetic. Significant upregulation of these targets was also observed in highly metastatic MDA-LM2 cells compared to poorly metastatic MDA-MB-231 cells. Mutual information values (MI, measured in bits) and the associated z-scores are also shown. n = 2 biologically independent experimental comparisons. b, qRT-PCR for NUPR1 and PANX2 in MDA-LM2 and the parental MDA-MB-231; n = 3 biologically independent experiments. c, qRT-PCR for NUPR1 and PANX2 in control, miR-378c, and miR-10b knockdown cells; n = 3 biologically independent experiments. d, NUPR1 and PANX2 expression levels in cells expressing a Tough Decoy against T3p (T3p-TuD) relative to control cells; n = 3 biologically independent experiments. A one-tailed Mann-Whitney test was used to calculate P for (b-d). e, Bioluminescence imaging plot of lung colonization by MDA-LM2 cells stably expressing CRISPRi guide RNAs against NUPR1, PANX2, or a control guide; n = 4 biologically independent animals per cohort. Statistical significance of knockdown versus control cohorts was measured using two-way ANOVA. The area under the curve was also calculated for each mouse; mean ± s.d. shown (change in normalized lung photon flux times days elapsed); P was calculated using a one-tailed Mann-Whitney test. f, NUPR1 and PANX2 expression levels were measured using qRT-PCR across 96 clinical samples composed of normal tissue and tissue from the indicated breast cancer stages. P was calculated using a one-tailed Mann-Whitney test (without adjustment). g, A schematic of model for T3p-mediated control of target genes in highly metastatic cells.
