Abstract
Dividing the human cerebral cortex into structurally and functionally distinct regions is important in many neuroimaging studies. Although many parcellations have been created for adults, they are not applicable for fetal studies, due to dramatic differences in brain size, shape and folding between adults and fetuses, as well as dynamic growth of fetal brains. To address this issue, we propose a novel method to divide a population of fetal cortical surfaces into distinct regions based on the dynamic growth patterns of cortical properties, which indicate the underlying changes of microstructures. As microstructures determine the molecular organization and functional principles of the cortex, growth patterns enable an accurate definition of distinct regions in development, microstructure, and function. To comprehensively capture the similarities of cortical growth patterns among vertices, we construct two complementary similarity matrices. One is directly based on the growth trajectories of vertices and the other is based on the correlation profiles of vertices’ growth trajectories in relation to those of reference points. Then, we nonlinearly fuse these two similarity matrices into a single one, which can better captures both their common and complementary information than by simply averaging them. Finally, based on this fused matrix, we perform spectral clustering to divide fetal cortical surfaces into distinct regions. We have applied our method on 25 normal fetuses from 26 to 29 gestational weeks and generated biologically meaningful parcellations.
Index Terms: Fetal, cortical parcellation, growth patterns
1. INTRODUCTION
Cortical parcellation aims to divide the cerebral cortex into a set of regions, which are distinct in structure, function and connectivity. It plays an important role in region-based and network-based neuroimaging analysis [1, 2]. Conventionally, the parcellations in adults are based on sulcal-gyral folding patterns [1], which, however, are not suitable for the fetal brain, due to the following two reasons. First, sulcal-gyral folding patterns are actually poorly corresponding with the boundaries defined by microstructure, function and development [3]. Second, primary and secondary cortical folds are not well established and are still developing rapidly in the fetal brain [4, 5], as shown in Fig. 1.
Fig. 1.
Dynamic development of fetal cortical surfaces from 26.3 to 28.9 weeks. The surfaces are color-coded by sulcal depth (mm).
To precisely and meaningfully divide fetal cortical surfaces into distinct and meaningful regions, leveraging the dynamic growth patterns of cortical properties (e.g., surface area, cortical thickness, and myelin content) is more appropriate. This is because growth patterns of cortical properties in fetus reflect the underlying changes of cortical microstructures and their connectivity, which essentially determines the molecular organization and functional principles of the cerebral cortex [6, 7]. Hence, parcellations based on the dynamic cortical growth patterns can precisely define distinct regions in development, microstructure, and function, and thus are ideally suitable for fetal brain studies, compared to the use of the conventional sulcal-gyral patterns. Therefore, in this paper, we develop a novel method for fetal cortical parcellation based on the dynamic growth patterns of cortical properties, thus filling both technical and knowledge gaps.
2. METHOD
2.1 Dataset and Cortical Surface Mapping
We adopted a fetal MRI dataset with 25 different healthy fetuses, and each fetus had only one time point. MR imaging was performed between 26 and 29 gestational weeks (GW). T2-weighted MR images were acquired on a 1.5 T scanner (SIEMENS MAGNETOM Aera) with an 8-channel body coil. All subjects were scanned without sedation and following the American college of radiology guidelines for pregnancy and lactation. Half Fourier acquisition single shot turbo spin echo (HASTE) sequences were used with the following parameters: echo time = 82 ms, repetition time = 1500 ms, slice thickness = 2.5 mm, field of view = 280×280 mm2, and voxel size = 0.5 × 0.5 × 2.5 mm3. For each subject, multiple orthogonal 2D scans were collected, including 4 axial, 2 coronal, and 2 sagittal stacks.
All MR images were processed using the following procedures. First, for each subject, we reconstructed a high-quality 3D MRI scan from multiple 2D scans using the method in [8]. Second, we segmented each 3D image into white matter, gray matter, cerebrospinal fluid, ventricles, cerebellum, and brainstem, by using a learning-based method [9]. Third, we masked and filled non-cortical structures, and also separated the left and right hemispheres. Fourth, we corrected topological errors and reconstructed cortical surfaces by using a topology-preserving deformable surface method [10]. Fifth, we mapped each cortical surface onto a spherical surface and co-registered spherical surfaces across all subjects [11]. Sixth, we resampled each cortical surface to a standard mesh tessellation, thus establishing inter-subject vertex-to-vertex cortical correspondences. Finally, for each cortical vertex, we computed its cortical properties, e.g., surface area, sulcal depth, and cortical thickness, and further spatially smoothed them [12]. Herein, the vertex-wise surface area was computed as one-third the sum of the areas of all triangles associated with this vertex [13].
2.2 Parcellation Based on Cortical Growth Patterns
To define the cortical growth patterns, ideally, we should use longitudinal fetal MRI data, which, however, is very difficult to obtain and involves ethical issues. Therefore, we leveraged healthy fetuses in a cross-sectional study to perform growth patterns based cortical parcellation. Specifically, we sorted all fetal cortical surfaces by age and constructed the growth trajectories of cortical properties of each vertex. Herein, we adopted the surface area as an example, as it develops more dynamically than other cortical properties in the fetal brain. But our method can also work on other cortical properties. Thus, we aimed to create a population-level cortical parcellation based on the growth patterns of surface area in the fetal brain. To this end, we first computed the similarity of growth patterns between each pair of vertices on the cortical surface. To comprehensively capture the growth patterns, we constructed two complementary similarity matrices S1 and S2, based on growth trajectories of surface area and growth correlation profile of surface area, respectively.
Specifically, we defined the similarity matrix S1 by using the growth trajectory of the surface area of each vertex as a feature vector F1. Between each pair of vertices i and j, we computed the Pearson’s correlation coefficient p of their growth trajectories and obtained their similarity as:
| (1) |
where N is the total number of vertices on the surface. Intuitively, high correlations of growth trajectories lead to high similarities of growth patterns. However, this similarity definition is inherently low-order, thus ignoring the complex and high-order similarity of growth patterns.
Hence, we defined the second similarity matrix S2 to more comprehensively compare the complex similarity of cortical growth patterns among vertices. First, we sampled 320 vertices uniformly on two cortical hemispheres as reference points. Then, for each vertex, we calculated the Pearson’s correlation coefficient between its growth trajectory of surface area and that of each of the reference points. In this way, for each vertex, we constructed a growth correlation profile as a new feature vector F2, representing the correlation of growth trajectories between this vertex and each of the reference points. We then computed the matrix S2 based on the growth correlation profiles of vertices as:
| (2) |
Intuitively, vertices with a high correlation of their growth correlation profiles have a high similarity of growth patterns. Thus S2, based on correlations of “correlations”, captured more complex and high-order similarity in growth patterns.
To divide the fetal cortical surface based on these two complementary similarity matrices S1 and S2, one intuitive method is to first simply average them and then perform clustering based on this averaged matrix. However, this method cannot fully capitalize on both common and complementary information across two matrices, thus leading to less meaningful parcellations. To address this issue, we non-linearly fused the two similarity matrices into a single matrix S that captured the full spectrum of underlying data, and then performed spectral clustering [14] based on the fused matrix. Our central idea was to iteratively update every matrix by diffusing reliable information across similarity matrices, thus making it more similar to each other until convergence [15]. Before non-linear fusion, we normalized these two similarity matrices by dividing the average value of each similarity matrix, respectively. To fuse these two similarity matrices, for each Sm, m ∈ {1,2}, we first computed a full kernel matrix Pm as:
| (3) |
Then, we also computed a sparse kernel matrix Qm as:
| (4) |
Note that, P1 and P2 encoded full similarity information among vertices, while Q1 and Q2 only captured reliable, high-similarity neighbors for each vertex. 𝒩i represented the K nearest neighbors of vertex i in terms of similarity. At iteration t, and were then updated as:
| (5) |
Herein T indicated matrix transpose. In this way, during the iterations, the isolated weak similarities gradually disappeared, while the strong similarities were added to each other. Meanwhile, the weak similarities supported by both matrices were retained, depending on their neighborhood connections across these two similarity matrices. After t* iterations, the fused matrix S, computed as the average of and , was adopted for parcellation using spectral clustering. As spectral clustering required a pre-defined cluster number [13], we determined an adequate number using both existing neuroscience knowledge and the widely-used silhouette coefficient.
3. RESULTS
3.1 Visual Inspection
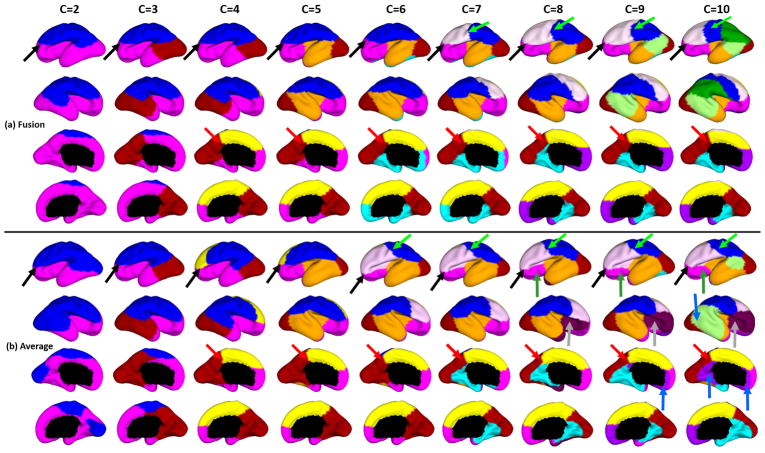
We performed the cortical parcellation based on the growth patterns of surface area, by utilizing 25 normal fetuses. In all results, we set K as 200 experimentally. Fig. 2 (a) and (b) show the parcellation results with different numbers of clusters from 2 to 10, by using the proposed fusion-based method and the averaging method, respectively. The proposed method led to biologically much more meaningful parcellations, as shown in Fig. 2. For example, at 2-clusters parcellation, the proposed method identified a dorsal-ventral division. With increase of the number of clusters, the proposed method revealed a meaningful hierarchical organization of the growth patterning of surface area. For example, the boundaries between the ventrolateral and dorsolateral prefrontal regions (as indicated by black arrows) were well-preserved from 2-clusters to 10-clusters by our proposed method. Also, the boundaries between the precuneus cortex and paracentral lobule (as indicated by red arrows) appeared in 4-clusters, and well preserved to 10-clusters by our method. In contrast, the corresponding boundaries by the averaging method were quite variable across different numbers of clusters, indicating unstableness of these clusters.
Fig. 2.
Fetal cortical surface parcellations based on the growth patterns of surface area, by (a) our proposed fusion of the two similarity matrices and (b) averaging the two similarity matrices.
Moreover, the parcellations by our method presented relatively symmetric patterns on the left and right hemispheres from 2-clusters to 10-clusters. In contrast, the parcellation results by the averaging method showed many meaningless left-right asymmetric patterns, especially from 8-clusters and 10-clusters, as indicated by blue, grey, light green and dark green arrows in Fig. 2 (b). For example, the dark red clusters of anterior insula and ventrolateral prefrontal regions, as indicated by grey arrows only appeared in the right hemisphere. The pink clusters at the left orbitofrontal region, as indicated by dark green arrows, have meaningless corresponding regions at the right temporal pole in 9- and 10-clusters. Also, the boundaries indicated by light green arrows crosscut the central sulcus on the left hemisphere, but the corresponding boundaries on the right hemisphere align with the precentral sulcus.
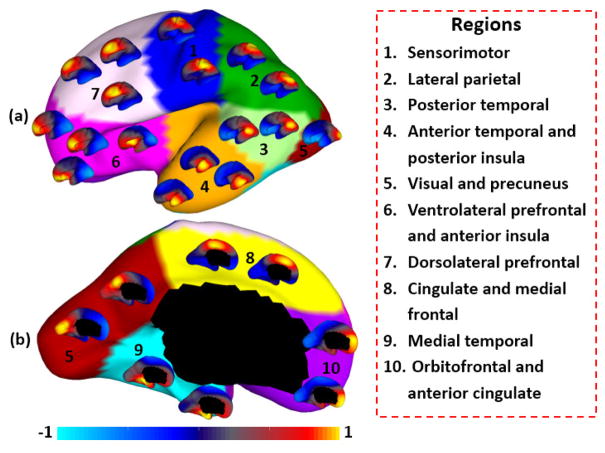
To further verify our parcellation at 10 clusters, we performed seed-based analysis of the correlation patterns of growth patterns of surface area, by using 25 uniformly distributed seeds on the surface, as indicated by the locations of small surfaces. As shown in Fig. 3, seeds in the same cluster yielded largely the similar correlation patterns, while seeds across the boundaries of clusters led to quite different patterns, indicating that our parcellation was meaningful.
Fig. 3.
Seed-based analysis of the correlation map of growth patterns of surface area. For each of 25 seeds, its correlation with all other vertices in terms of growth patterns is shown as a small respective color-coded surface map.
3.2 Quantitative Evaluation
To determine the optimal number of clusters, we used the commonly used silhouette coefficient to evaluate our parcellations. Silhouette coefficient describes the intra-class dissimilarity and the inter-class dissimilarity, computed by:
| (6) |
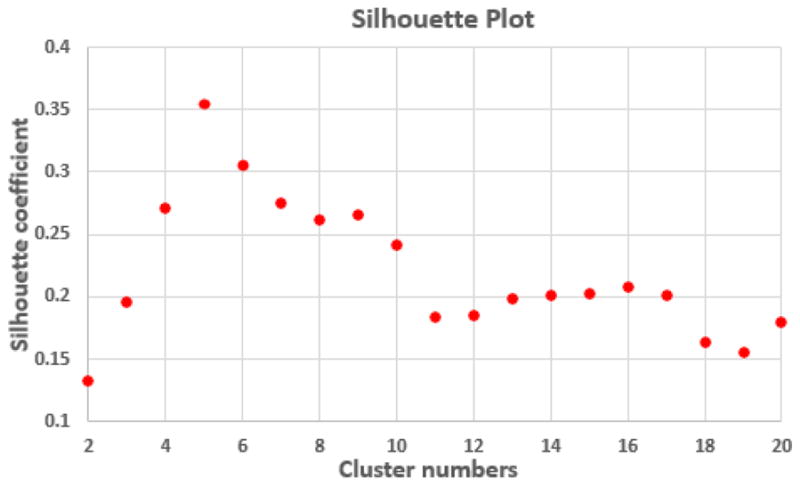
where sc(i) is the silhouette coefficient for the vertex i, and a(i) is the average dissimilarity between the vertex i and all other vertices in the same cluster; b(i) is the minimum average dissimilarity of vertex i to any other clusters that the vertex i does not belong to. Herein, the dissimilarity between two vertices i and j is computed as 1 – S(i, j). We determined the optimal number of clusters by searching for the numbers of clusters with high and stable silhouette coefficients. Fig. 4 shows the silhouette coefficients of parcellations by our method, when setting the cluster number from 2 to 20. The high silhouette coefficient corresponds to 5-clusters. After that, the coefficient reaches a stable plateau from 6- to 10-clusters, and then decreases significantly after 10-clusters. To capture the detailed regionalization of growth patterns of surface area, we adopted 10-clusters parcellations as shown in Fig. 3, where all clusters largely correspond to structurally and functionally meaningful specializations, with their approximated names shown in right columns in Fig. 3.
Fig. 4.

Silhouette coefficients of the parcellations by the proposed method with different number of clusters.
4. CONCLUSION
This paper has two major contributions. First, we proposed a novel cortical parcellation method based on the growth patterns of cortical properties. We constructed two similarity matrices to comprehensively capture both the low-order and high-order similarities of growth patterns of vertices. To effectively leverage their information, we nonlinearly fused these two similarity matrices as a single one for clustering, thus better capturing both their common and complementary information. Second, by applying our method, we derived the first set of fetal cortical surface parcellation maps based solely on dynamic growth patterns of surface area. In future, we will combine other cortical properties for fetal cortical surface parcellation.
Acknowledgments
This work was partially supported by NIH grants (MH100217, MH108914, MH107815, MH110274).
References
- 1.Desikan RS, Ségonne F, Fischl B, et al. An automated labeling system for subdividing the human cerebral cortex on MRI scans into gyral based regions of interest. NeuroImage. 2006;31(3):968–980. doi: 10.1016/j.neuroimage.2006.01.021. [DOI] [PubMed] [Google Scholar]
- 2.Cachia A, Mangin JF, et al. A generic framework for the parcellation of the cortical surface into gyri using geodesic Vorono diagrams. Med Image Anal. 2003;7:403–416. doi: 10.1016/s1361-8415(03)00031-8. [DOI] [PubMed] [Google Scholar]
- 3.Zilles K, Amunts K. Centenary of Brodmann’s map--conception and fate. Nat Rev Neurosci. 2010;11(2) doi: 10.1038/nrn2776. [DOI] [PubMed] [Google Scholar]
- 4.Studholme C. Mapping fetal brain development in utero using magnetic resonance imaging: the Big Bang of brain mapping. Annu Rev Biomed Eng. 2011;13:345–368. doi: 10.1146/annurev-bioeng-071910-124654. [DOI] [PMC free article] [PubMed] [Google Scholar]
- 5.Benkarim OM, Sanroma G, Zimmer VA, et al. Toward the automatic quantification of in utero brain development in 3D structural MRI: A review. Hum Brain Mapp. 2017 doi: 10.1002/hbm.23536. [DOI] [PMC free article] [PubMed] [Google Scholar]
- 6.Dubois J, Dehaene-Lambertz G. Fetal and postnatal development of the cortex: MRI and genetics. In: Toga AW, editor. Brain Mapping: An Encyclopedic Reference. 2015. pp. 11–19. [Google Scholar]
- 7.Clouchoux C, Kudelski D, Gholipour A, et al. Quantitative in vivo MRI measurement of cortical development in the fetus. Brain Struct Funct. 2012;217(1):127–139. doi: 10.1007/s00429-011-0325-x. [DOI] [PubMed] [Google Scholar]
- 8.Kuklisova-Murgasova M, et al. Reconstruction of fetal brain MRI with intensity matching and complete outlier removal. Med Image Anal. 2012;16(8):1550–1564. doi: 10.1016/j.media.2012.07.004. [DOI] [PMC free article] [PubMed] [Google Scholar]
- 9.Sanroma G, Benkarim OM, Piella G, et al. Building an ensemble of complementary segmentation methods by exploiting probabilistic estimates. MICCAI-MLMI. 2016:27–35. [Google Scholar]
- 10.Li G, Nie J, et al. Measuring the dynamic longitudinal cortex development in infants by reconstruction of temporally consistent cortical surfaces. NeuroImage. 2014;90:266–279. doi: 10.1016/j.neuroimage.2013.12.038. [DOI] [PMC free article] [PubMed] [Google Scholar]
- 11.Yeo BT, Sabuncu MR, et al. Spherical demons: fast diffeomorphic landmark-free surface registration. IEEE TMI. 2010;29:650–668. doi: 10.1109/TMI.2009.2030797. [DOI] [PMC free article] [PubMed] [Google Scholar]
- 12.Li G, Wang L, Shi F, et al. Construction of 4D high-definition cortical surface atlases of infants: Methods and applications. Med Image Anal. 2015;25(1):22–36. doi: 10.1016/j.media.2015.04.005. [DOI] [PMC free article] [PubMed] [Google Scholar]
- 13.Li G, Nie J, Wang L, et al. Mapping region-specific longitudinal cortical surface expansion from birth to 2 years of age. Cereb Cortex. 2012;23(11):2724–2733. doi: 10.1093/cercor/bhs265. [DOI] [PMC free article] [PubMed] [Google Scholar]
- 14.Ng AY, Jordan MI, Weiss Y. On spectral clustering: Analysis and an algorithm. NIPS. 2002:849–856. [Google Scholar]
- 15.Wang B, Mezlini AM, Demir F, et al. Similarity network fusion for aggregating data types on a genomic scale. Nat Methods. 2014;11(1):333–337. doi: 10.1038/nmeth.2810. [DOI] [PubMed] [Google Scholar]


