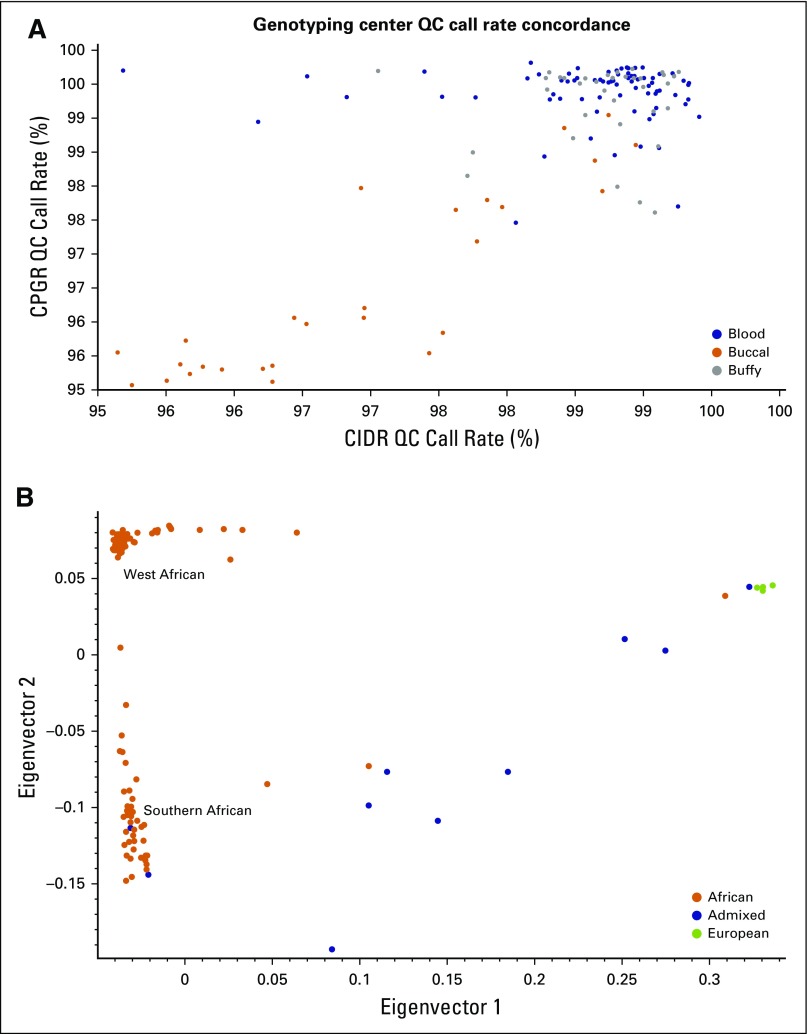
Fig 3.
Results of genotype analyses of study samples. (A) Success rate of samples assayed on the Axiom Array. (B) Results of principal components analysis to evaluate genomic ancestral population groups where different colors represent different population groups; orange represents African, blue represents admixed, and green represents European. Eigenvalues indicates the amount of variation in the sample data. Eigenvectors are the linear combinations showing how variables contribute to each axis. CIDR, Center for Inherited Disease Research; CPGR, Centre for Proteomics and Genomics Research; QC, quality control.

