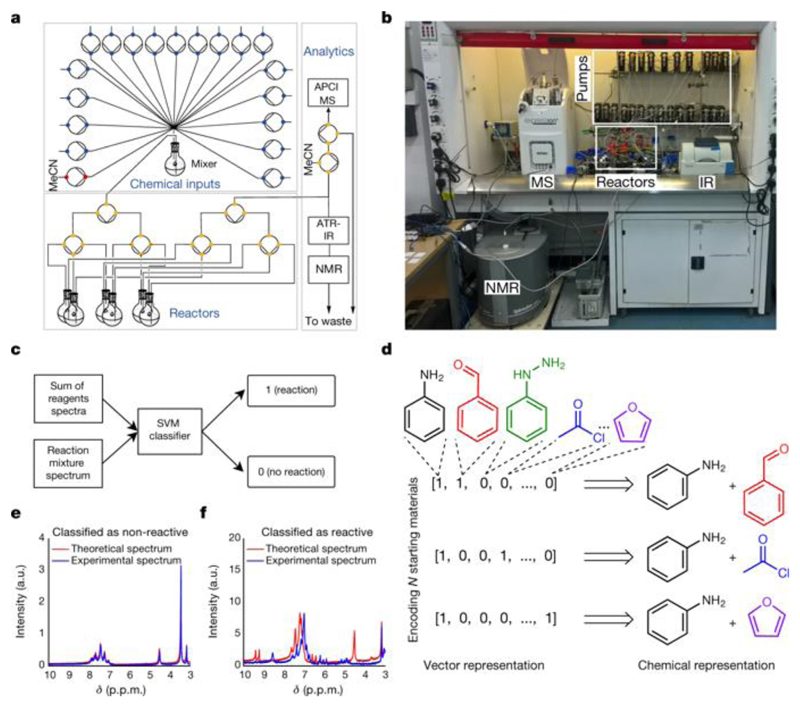
Fig. 1. Automatic reaction detection with machine learning.
a, Schematic of the chemical robot. The circles are pumps and the coloured dots are the positions of the valves. APCI, atmospheric pressure chemical ionization; MS, mass spectrometer; ATR-IR, attenuated total reflectance infrared spectrometer. b, Photograph of the chemical robot, showing the pumps, reactors and real-time analytics, including the NMR, MS and infrared (IR) spectroscopy systems. c, SVM workflow for reaction detection using infrared and NMR spectroscopy, utilizing changes in the spectra. d, Reaction space representation using vectors. e, Example of a 1H NMR (43 MHz, MeCN) spectrum for a non-reactive reaction mixture. a.u., arbitrary units. f, Example of a reaction mixture 1H NMR (43 MHz, MeCN) spectrum for which a chemical reaction has been detected.

