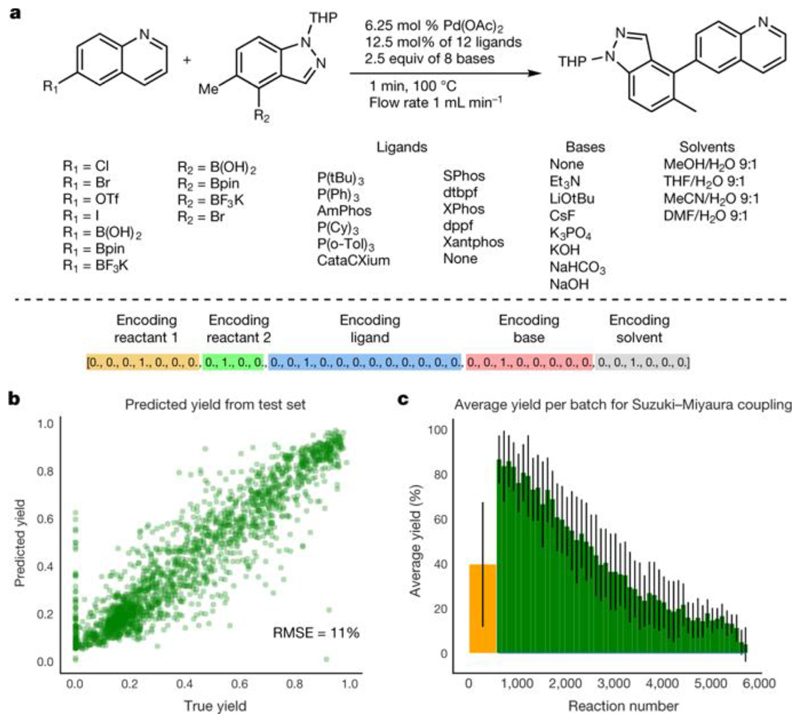
Fig. 4. Exploring the Suzuki–Miyaura reaction using machine learning.
a, The reaction space of the Suzuki–Miyaura reaction. Shown are the identity of reactants, ligand, base and solvent, and the vector representation of the reaction for machine learning. b, Validation of the predictive power of the model for a test set of 30% of the reactions (1,728 reactions). RMSE, root-mean-square error. c, Simulation of the machine-learning-controlled exploration of this reaction space. The yellow bar shows the initial random choice of 10% of reaction space (576 reactions). The green bars show the next batches of 100 reactions chosen by the machine learning algorithm. The error bars represent the standard deviation within individual batches for Suzuki–Miyaura coupling.

