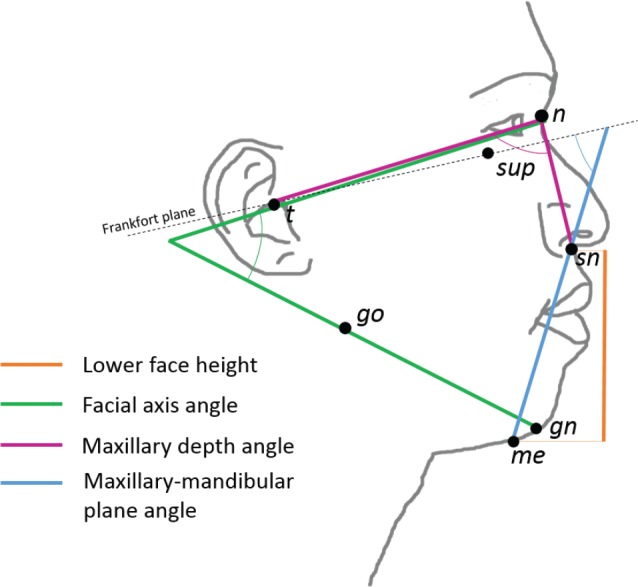
Figure 2. Illustration of facial measurements related to oral appliance treatment response.

Four craniofacial measurements derived from profile photographs differed between responders and nonresponders and were considered in prediction models. Lower face height (linear distance between landmarks sn and me), facial axis angle (angle formed between the line intersecting landmarks t and n and the line intersecting landmarks go and gn), maxillary depth angle (angle between landmarks t, n, and sn), and maxillary-mandibular plane angle (angle of the intersection of the Frankfort plane and line connecting through landmarks me and sn). Landmarks: gn = gnathion, go = gonion, me = menton, n = nasion, sn = subnasion, sup = infraorbital rim, t = tragion.
