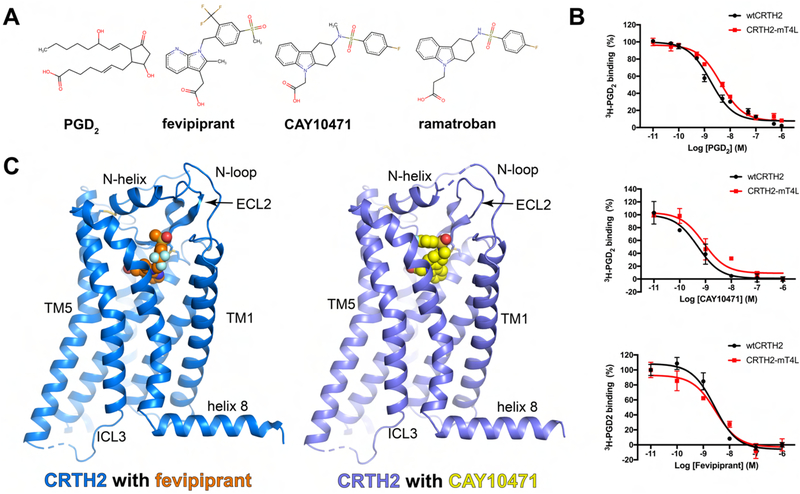
Figure 1.
CRTH2 ligands and overall structures. (A) Chemical structures of PGD2, fevipiprant, CAY10471 and ramatroban and the conserved carboxylate group. (B) Competition radioactive ligand binding assays with HEK-293T cell membranes expressing wtCRTH2 and CRTH2-mT4L. For each experiment, 2 nM [3H] PGD2 was used and various concentrations of PGD2 (top), CAY10471 (middle) and fevipirant (bottom) were added as competing ligands. Data points are presented as the mean values +/− SEM, n=3. (C) Overall structures of fevipiprant-bound and CAY10471-bound CRTH2 are colored in blue and slate, respectively. Fevipiprant and CAY10471 are shown as orange and yellow spheres.

