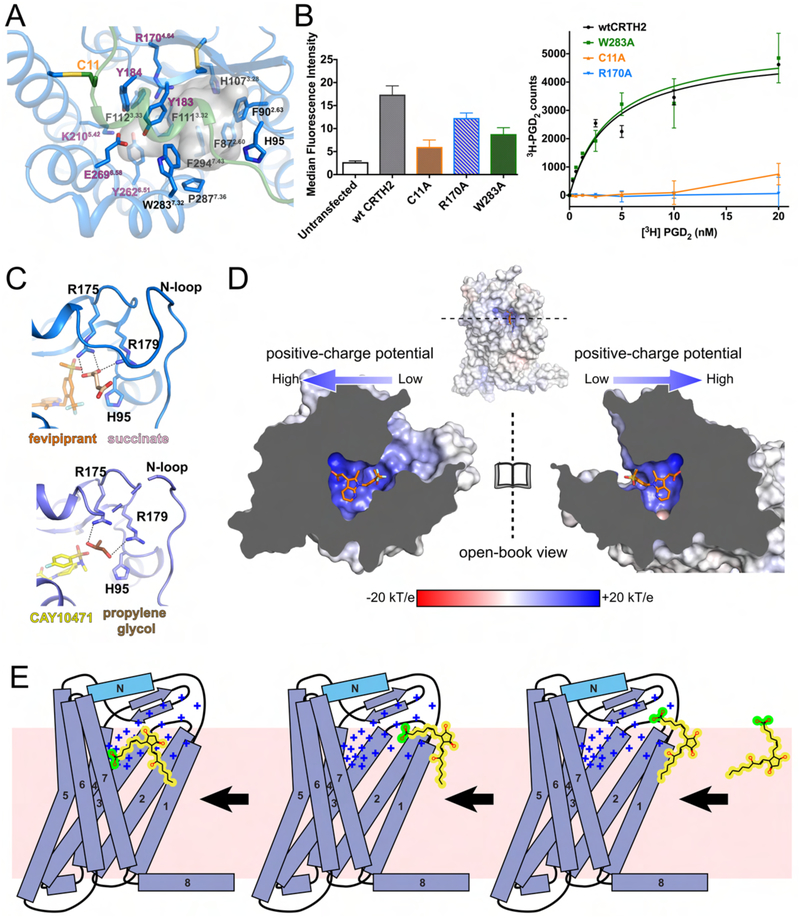
Figure 5.
PGD2 binding. (A) Potential binding pocket for PGD2 as shown by the transparent grey cavity. The polar residues that may be involved in the interactions with the carboxylate group in PGD2 are labeled in purple. (B) Cell surface expression levels of wild-type CRTH2 (wtCRTH2) and three mutants (left) and their specific saturation binding of 3H-PGD2 (right). The cell surface expression of each construct in HEK-293T cells was assessed by measuring the binding of fluorescent anti-FLAG antibodies to the FLAG epitope displayed at the N-terminus of the receptor through flow cytometry. The specific saturation binding assays were performed using cell membranes. The W283A mutant is shown as a positive control, in which the binding of PGD2 was not significantly altered. Data points are presented as the mean values +/− SEM, n=3. (C) Succinate (pink) and propylene glycol (brown) molecules modeled in the structures of fevipiprant-bound CRTH2 (blue) and CAY10471-bound CRTH2 (slate). The hydrogen bonds are shown as black dashed lines. (D) Charge distribution of the ligand-binding pocket of CRTH2 (open-book view). Fevipiprant is shown as orange sticks. (E) Cartoon diagram of the proposed PGD2 binding process. The positive charge potential is indicated as “+”. The lipid bilayer is shown as the pink background. The carboxylate group in PGD2 is colored in green, while the rest hydrophobic moiety of PGD2 is colored in yellow.

