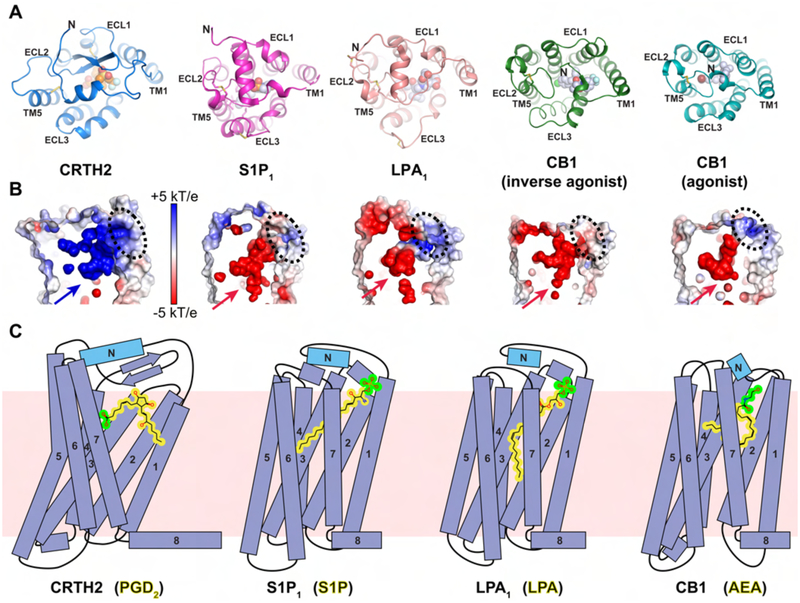
Figure 6.
Structural comparison of CRTH2 to lipid GPCRs S1P1, LPA1 and CB1. (A) Extracellular regions in the structures of CRTH2 (blue), S1P1 (magenta, PDB ID 3V2W), LPA1 (pink, PDB ID 4Z35), CB1 with an inverse agonist (green, PDB ID 5U09) and CB1 with an agonist (cyan, PDB ID 5XRA). Fevipiprant (orange) and ligands in other GPCRs (light blue) are shown as spheres. For S1P1 and LPA1, only antagonist-bound structures are available. See also Figure S6A. (B) Charge distribution of the ligand-binding pockets pointed by arrows of these GPCRs shown in A. The potential ligand access ports are marked with black dashed circles. (C) Cartoon diagrams of the ligand-binding modes of four lipid GPCRs. From the left to the right: CRTH2 with prostanglandin D2 (PGD2), S1P1 with sphingosine-1-phosphate (S1P), LPA1 with lysophosphatidic acid (LPA) and CB1 with N-arachidonoylethanolamine (AEA). The lipid bilayer is shown as the pink background. For all ligands, the polar head groups are colored in green, while the rest hydrophobic moieties are colored in yellow.

