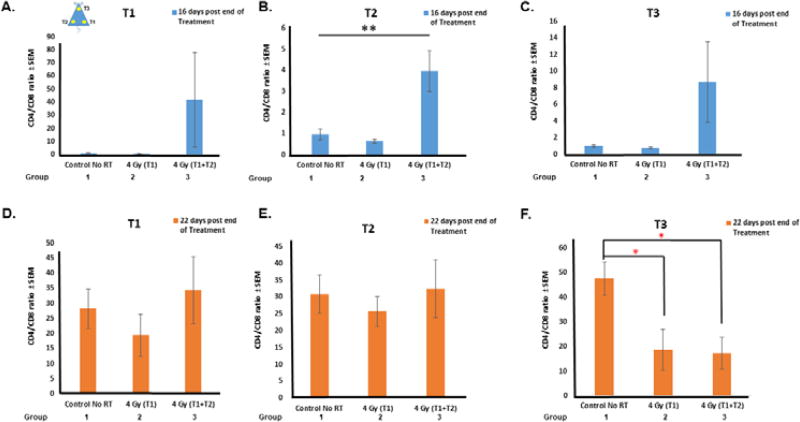
Figure 3.
CD4+ and CD8+ T-cell subsets in the indicated mice tumors following indicated treatments. CD4:CD8 ratios were determined for all tumors at sixteen (A–C) and twenty two (D–F) days post end of treatment. Ratio is expressed ± standard error of the mean (SEM). Four mice per group were evaluated. ** p<0.005 one-way ANOVA; * p<0.05 Student’s paired t-test.

