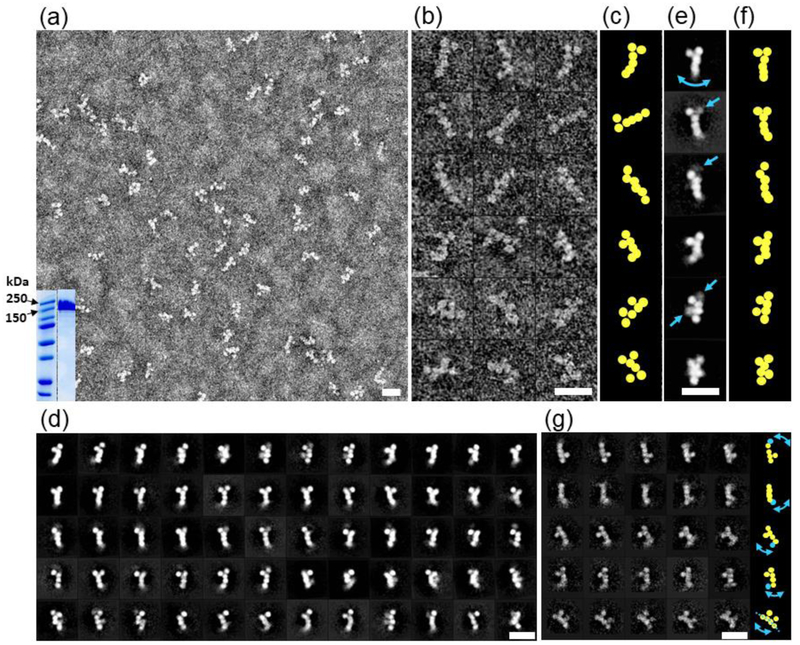
Figure 2: Negative-stain EM images of n1α.
a) Survey view of n1α L1-L6 particles; analysis of n1α L1-L6 by SDS-PAGE with relevant markers indicated in kDa (inset); b) 18 representative raw images of n1α L1-L6 particles.; c) Schematic highlighting the different organizations of domains.; d) 60 representative averaged particles selected from 100 reference-free class averages calculated from 15,402 particles picked from 150 micrographs. Select domains have a blurry appearance because they are averaged away due to conformational heterogeneity.; e) Six representative reference-free class averages. Arrows indicate domains with conformational heterogeneity.; f) Schematic highlighting the organization of domains.; g) 25 representative averaged particles selected from 1,043 reference-free class averages calculated from 15,402 particles showing that even with fewer particles per class there is significant conformational variability within every row (domain with high conformational variability indicated in cyan). Arrows in the schematic on the right panel show the corresponding variation of domains. Scale bars are 200 Å.

