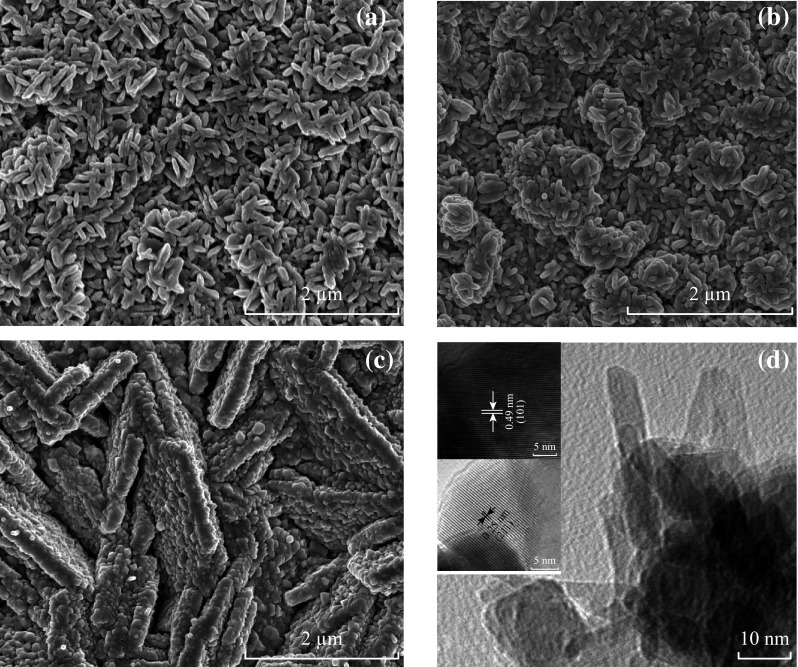
Fig. 2.

Surface morphologies of Mn3O4 samples a Mn(0.01@30), b Mn(0.05@30), and c Mn(0.1@30). d TEM image of Mn(0.05@30) showing cross-inter-linked nano-platelets with the length range from 20 to 50 nm and the width range from 5 to 10 nm. The inset HRTEM images showing lattice spacing
