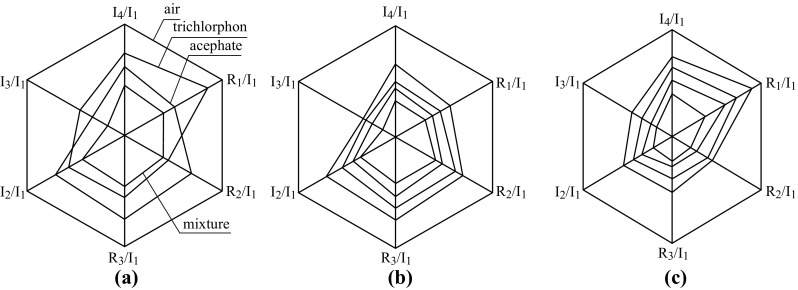
Fig. 17.

a Characteristic responses of the relative intensities of the higher harmonics. R i and L i are the real and imaginary components of the ith higher harmonic. The analyzed data correspond to the resistance values in the concentrations of 1.053 μg L−1 trichlorphon, 0.75 μg L−1 acephate, and their mixture. b, c Effects of concentrations of pesticide vapor on the relative intensities of the higher harmonic. The concentrations from inside to outside are 0.75, 2.25, 3.75, and 5.25 μg L−1; and 1.053, 3.159, 5.265, and 7.371 μg L−1, respectively. b acephate, c trichlorphon. Adapted from reference [213]
