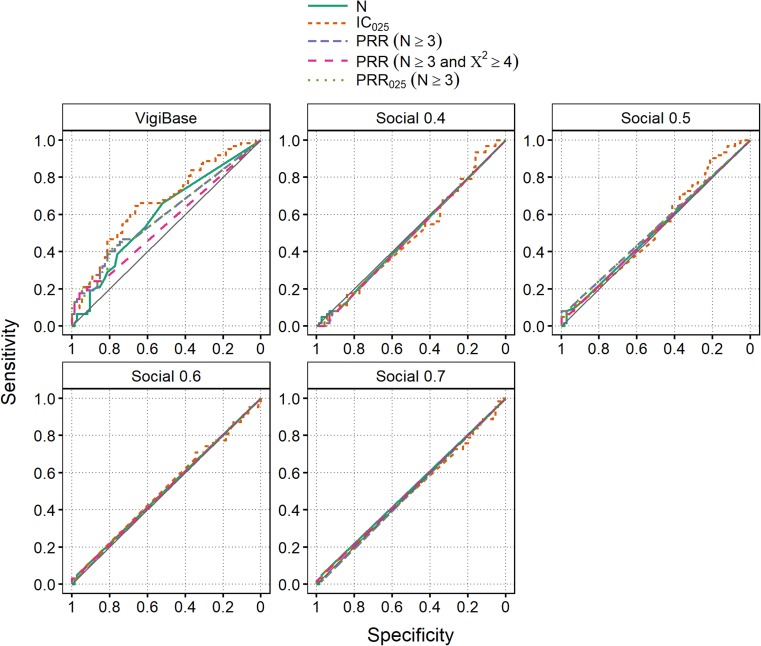
Fig. 1.
Receiver operating characteristic curves for the Harpaz reference set, using data from March 2012 up to the month prior to the index dates for positive controls, and up to December 2013 for negative controls. ‘Social 0.X’ means Twitter/Facebook data with a post-level indicator score threshold of 0.X. The area under the curve ranges between 0.55 and 0.67 in VigiBase, and is 0.53 or lower in Twitter/Facebook. The diagonal represents a random classifier. IC Information Component, PRR Proportional Reporting Ratio

