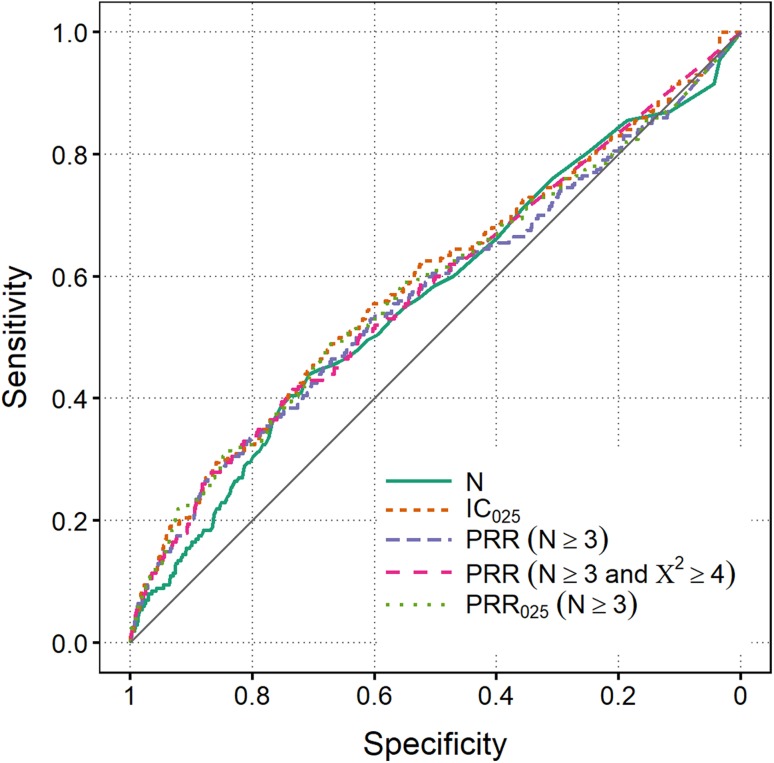
Fig. 2.
Receiver operating characteristic curves for VigiBase based on the WEB-RADR reference set. All historical data are used, up to the month prior to the index dates for positive controls, and up to March 2015 for negative controls. Area under the curve values range between 0.56 and 0.59. The diagonal represents a random classifier. IC Information Component, PRR Proportional Reporting Ratio

