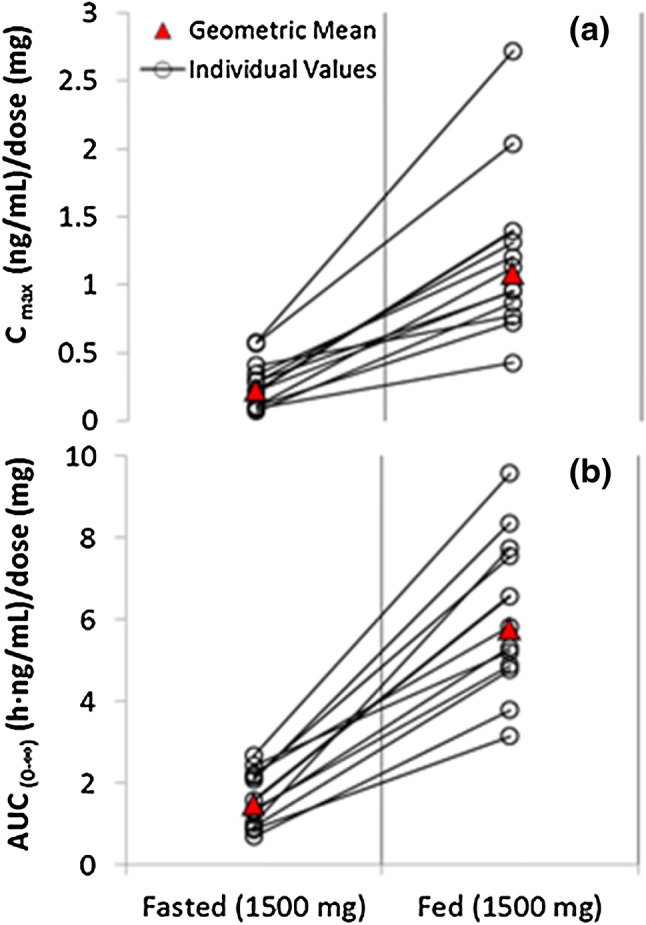
Fig. 3.

Geometric mean and individual (expressed as dose normalized) Cmax (a) and AUC∞ (b) of CBD for the fasted and fed state following a single 1500 mg dose of CBD (pharmacokinetic set). AUC∞ area under the concentration-time curve from time zero to infinity, CBD cannabidiol, Cmax maximum measured plasma concentration
