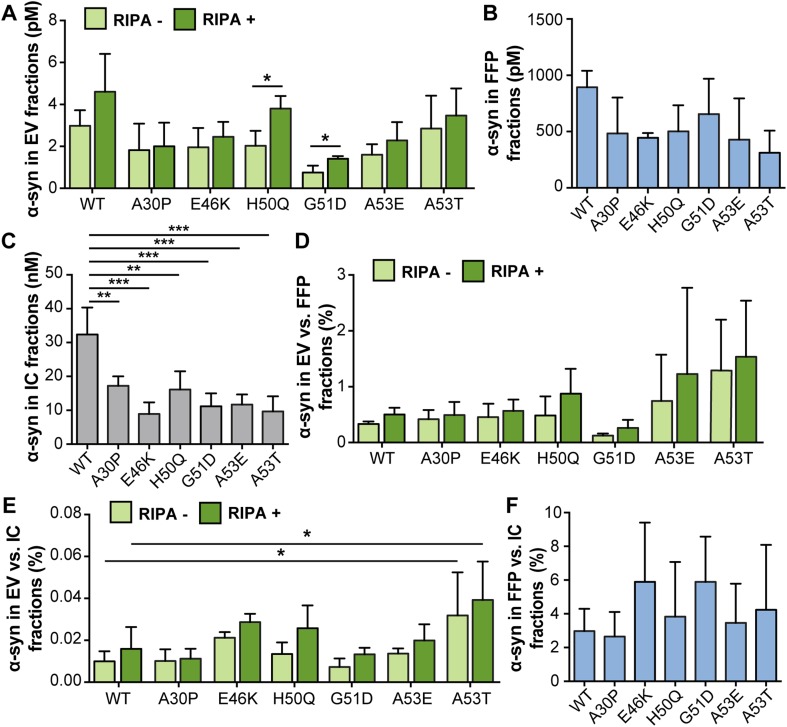
Fig. 6.
A53T α-syn was enriched in the EV fraction. a Absolute levels of α-syn in EV (light green: RIPA–, dark green: RIPA+), b FFP and c IC fractions, as measured by ELISA. d Percentage of α-syn in EV compared to FFP fractions. e Percentage of α-syn in EV compared to IC fractions. f Percentage of α-syn in FFP compared to IC fractions. The distribution of A53T differed from WT α-syn and the other mutants and was higher in both RIPA+ and RIPA− fractions when normalized against IC values. Bars represent mean ± SD, n = 3. Differences between the respective RIPA− and RIPA+ fractions from WT α-syn were calculated by one-way ANOVA with Dunnett’s post hoc test (*p < 0.05, **p < 0.01, ***p < 0.001)

