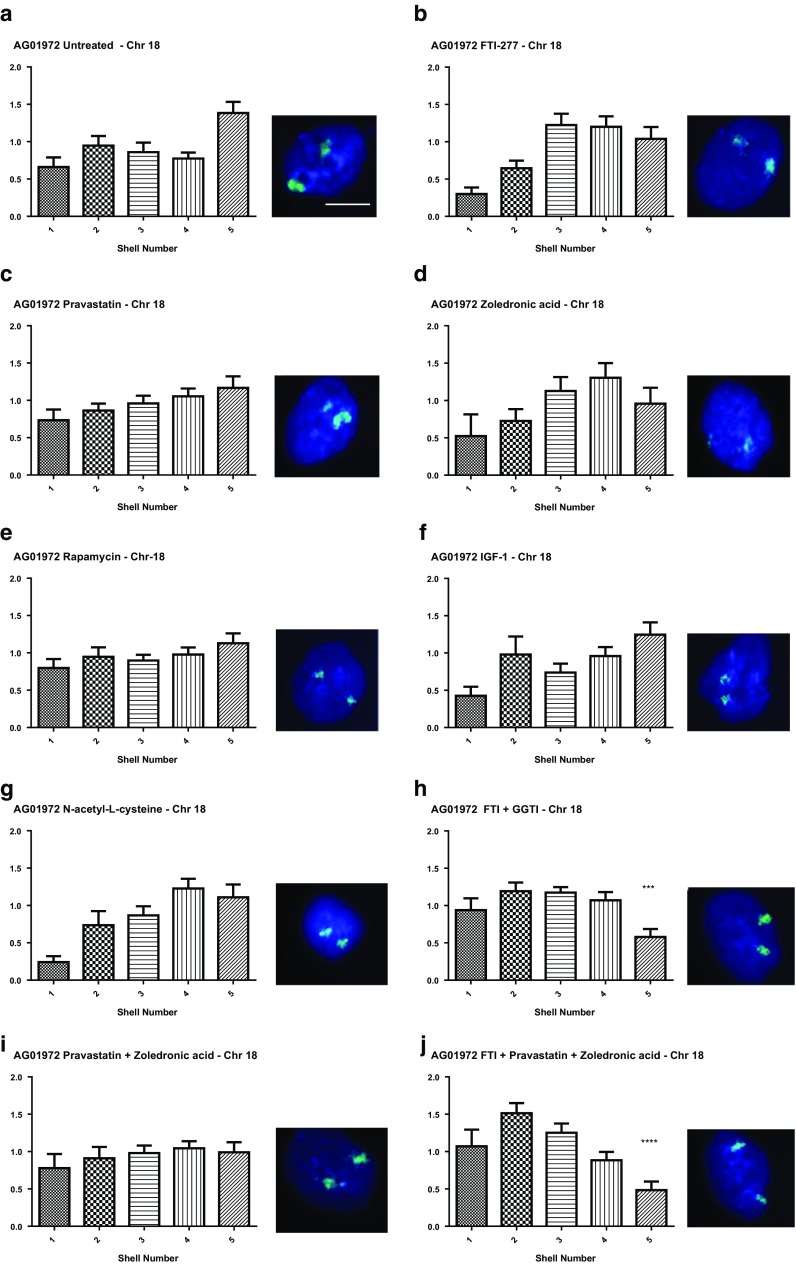
Fig. 2.
Position of chromosome 18 within HGPS fibroblast nuclei before and after drug treatments. HGPS fibroblasts, treated and untreated were fixed and subjected to FISH using whole chromosome arm painting probes specific for chromosome 18. Images were captured at ×100 magnification. Positional information of the chromosome 18 territories within interphase nuclei was ascertained through erosion analysis revealing the proportion of chromosome signal (%), normalised by the DAPI signal, over five concentric shells of equal area, starting at the nuclear periphery (shell 1) to the nuclear interior (shell 2). These data are displayed graphically as bar charts with the x-axis displaying the erosion shells from 1 to 5 (left to right. The y-axis displays % normalised chromosome signal. Panels are as follows a untreated, b FTI-277, c pravastatin, d zoledronic acid, e rapamycin, f IGF-1, g N-acetyl-l-cysteine, h FTI-277 and GGTI-2133, i pravastatin and zoledronic acid and j FTI-277, pravastatin and zoledronic acid. Representative images the interphase nuclei are displayed to the right of each graph. DAPI (blue) is used as a counterstain to delineate the nuclei and the chromosome 18 territories are revealed in green. Scale bar = 10 µM

