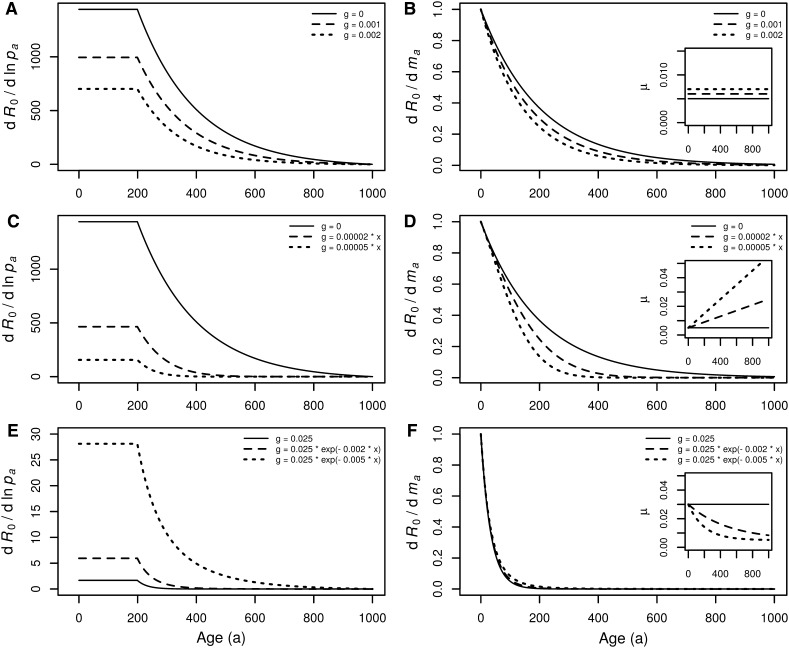
Fig. 2.
Selection gradients for R0 under different extrinsic mortalities. a, b age-independent extrinsic mortality, c, d extrinsic mortality increasing with age, and e, f extrinsic mortality decreasing with age. Each panel is characterized by the same lx and mx vectors as corresponding panel in Fig. 1. Insets show the total age-specific mortality calculated as , where g (extrinsic mortality) is delivered in figures’ legends. For further details see description of Fig. 1

