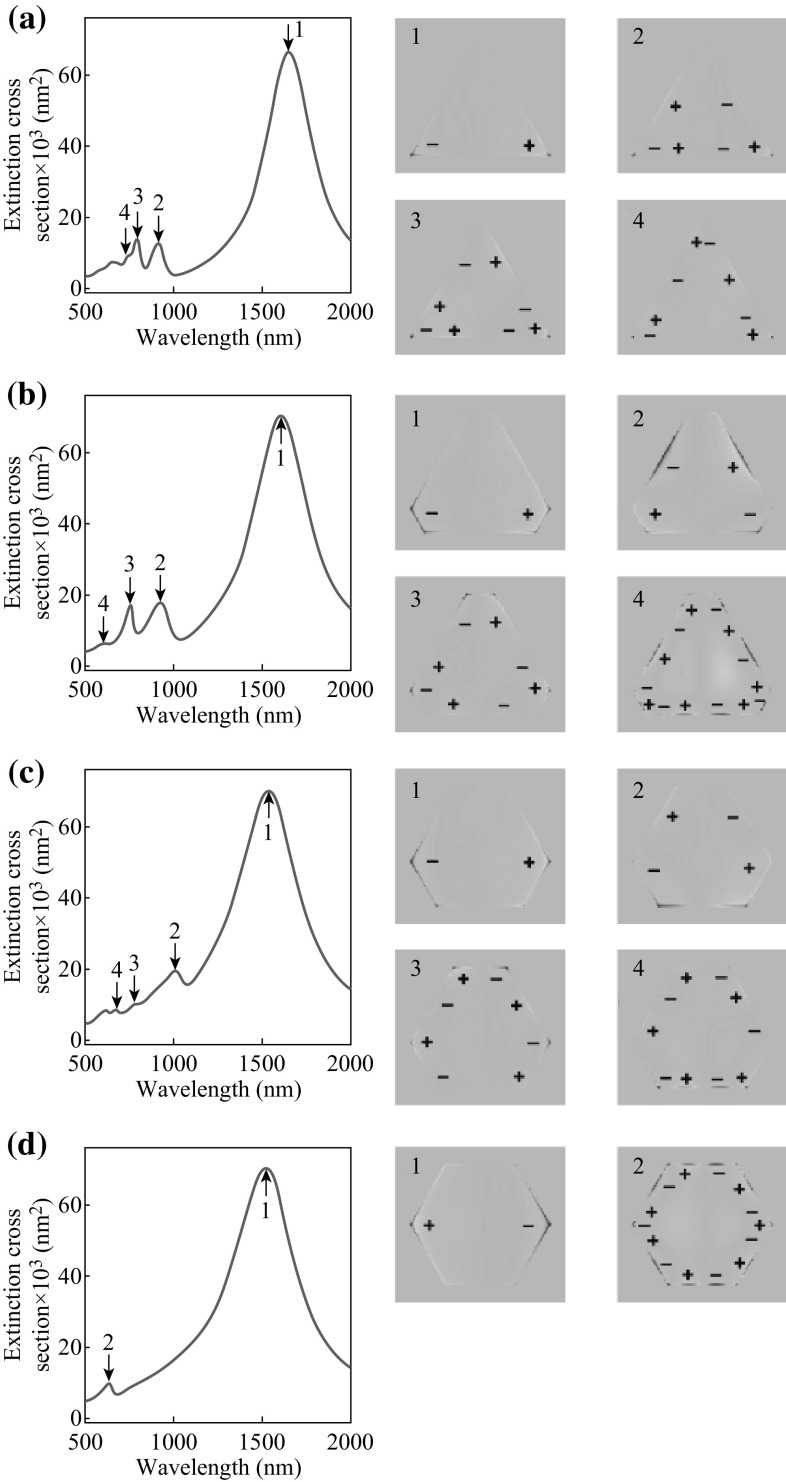
Fig. 10.
a Calculated extinction spectra (left) and corresponding charge distribution profiles (right) of the triangular gold nanoplate with 400 nm edges. Four plasmonic resonance modes can be identified in the extinction spectra (arrows), corresponding to the charge distribution profiles of the dipole (1), quadrupole (2), and higher-ordered (3, 4) modes. b Those for the truncated triangular nanoplate with 80 nm truncated edges. c Those for the truncated triangular nanoplate with 150 nm truncated edges. d Those for the hexagonal nanoplate with 200 nm edges

