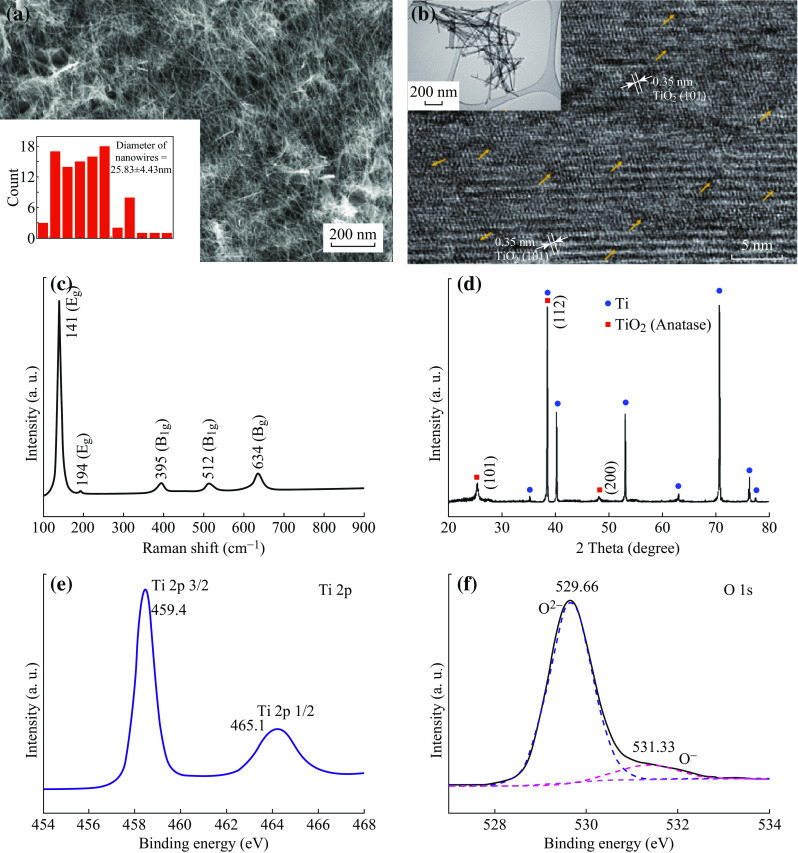
Fig. 1.

Characterization of TiO2 nanowires. a Top view SEM image (inset, statistical summary of diameters of ~ 100 nanowires); b HRTEM image, yellow arrows indicate the crystalline defects (inset, TEM image of TiO2 nanowires); c Raman spectrum; d XRD results; e Ti 2p XPS spectrum; and f O 1s XPS spectrum
