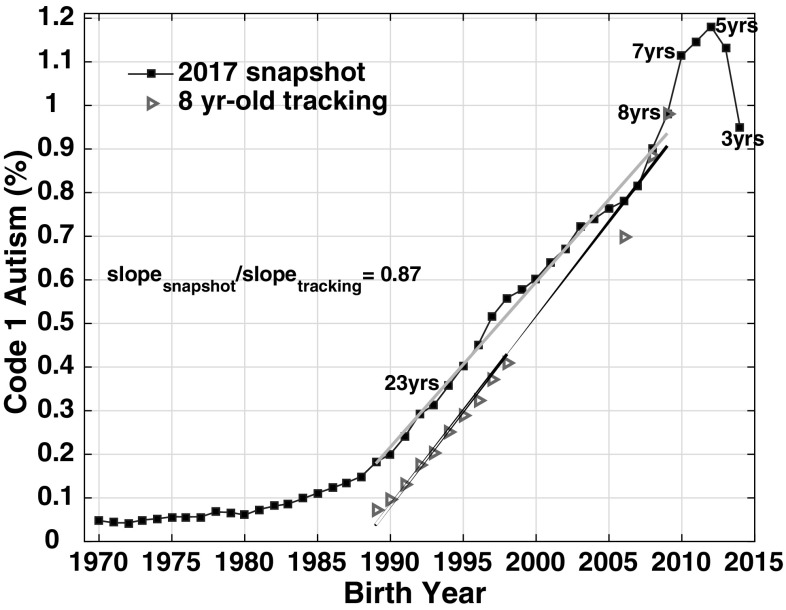
Fig. 2.
CDDS data from 1997 to 2006, 2014, 2016 and 2017 reports, comparing 8 year-old tracking (red triangles) to 2017 age-resolved snapshot (blue squares) slopes over birth year interval 1989–2009. The bsnap:btrack slope ratio, representing the ratio of the grey:black slopes, is 0.87. Selected ages are labeled on the blue age-resolved snapshot curve, indicating the age of each birth cohort in 2017. (Color figure online)

