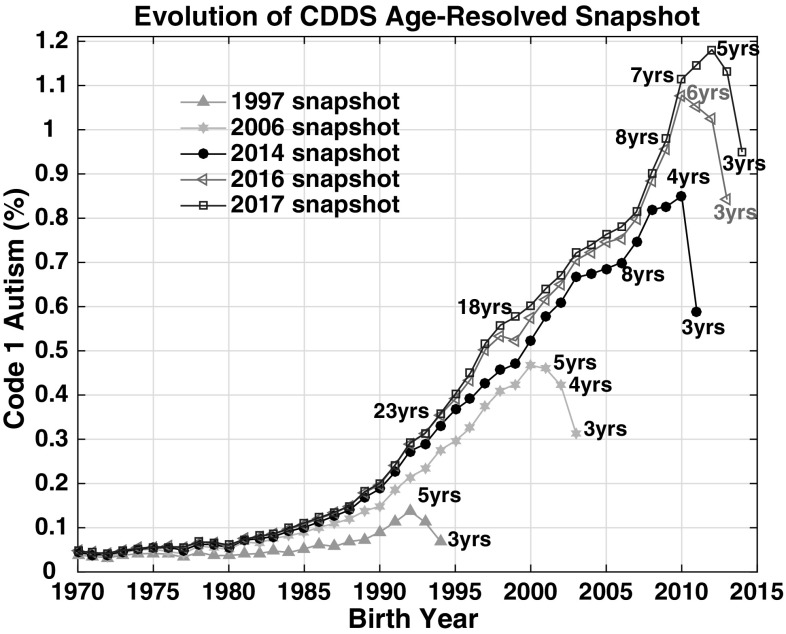
Fig. 3.
CDDS Code 1 autism data comparing 1997 (green triangles), 2006 (cyan squares), 2014 (black circles), 2016 (magenta triangles) and 2017 (blue squares) age-resolved snapshots. Selected ages are labeled on each snapshot curve, indicating the age of each birth cohort at the time each respective CDDS report was compiled. (Color figure online)

