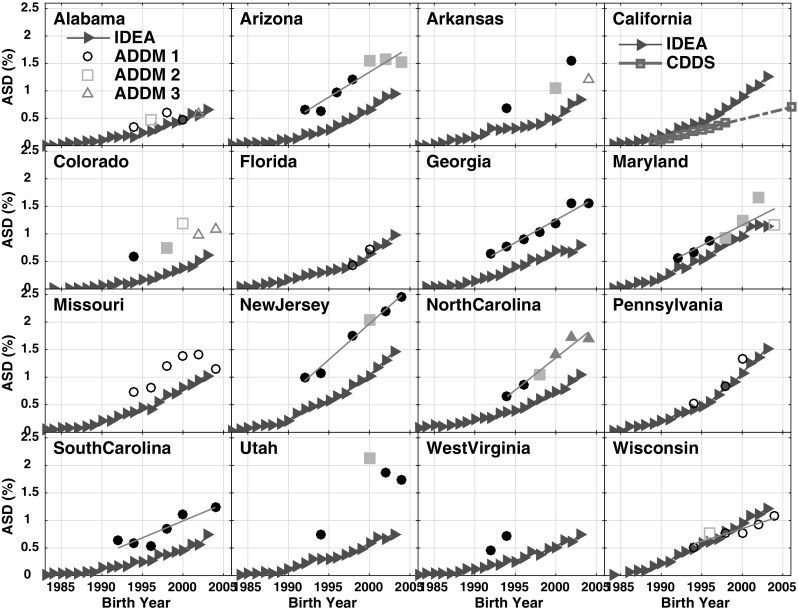
Fig. 5.

Comparison of data tracking ASD prevalence among 8 year-olds from 3 different networks. IDEA data (red triangles) tracking 8 year-olds over report years 1991–2011 (corresponding to birth years 1983–2003) are available for all states. In California, the IDEA data are compared to CDDS 8 year-olds (magenta squares) tracked from report years 1997–2006 and 2014 (birth years 1989–1998 and 2006). For all other states, the IDEA data are compared to ADDM 8 year-olds tracked biannually from birth years 1992–2004. Up to 3 different black or grey symbols are used for the ADDM data to denote shifts and inconsistencies in the number of counties sampled within each state in successive reports. In addition, the ADDM data are plotted as solid symbols for prevalence derived based on both health and education records and as open symbols when only health records were available. (Color figure online)
