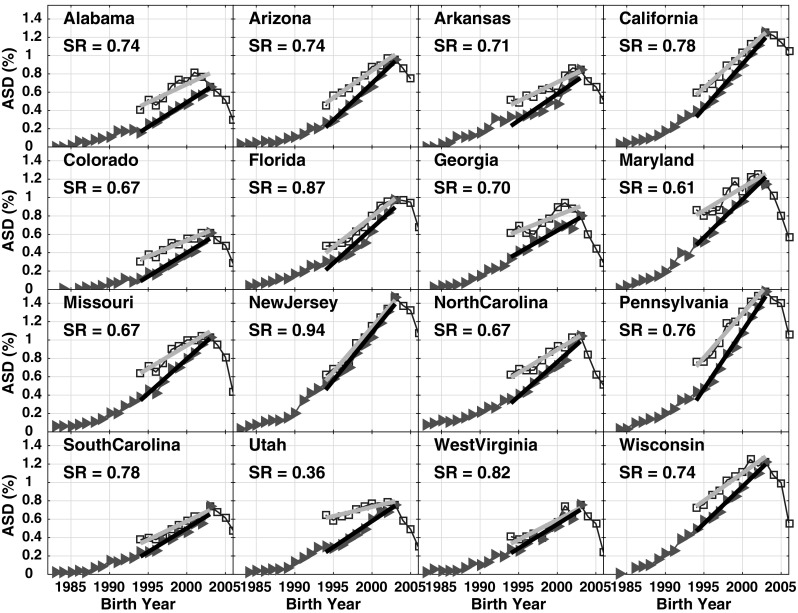
Fig. 6.

IDEA data from 1991 to 2011 reports, comparing 8 year-old tracking data (red triangles) to 2011 IDEA age-resolved snapshot data (blue squares). The slopes of the ASD prevalence increase over birth year interval 1994–2003 are determined by least squares linear regression and plotted as gray and black lines for the 2011 snapshot and 8 year-old tracking, respectively. The bsnap:btrack slope ratio (SR) is shown in each panel, representing the ratio of the grey:black slopes. (Color figure online)
