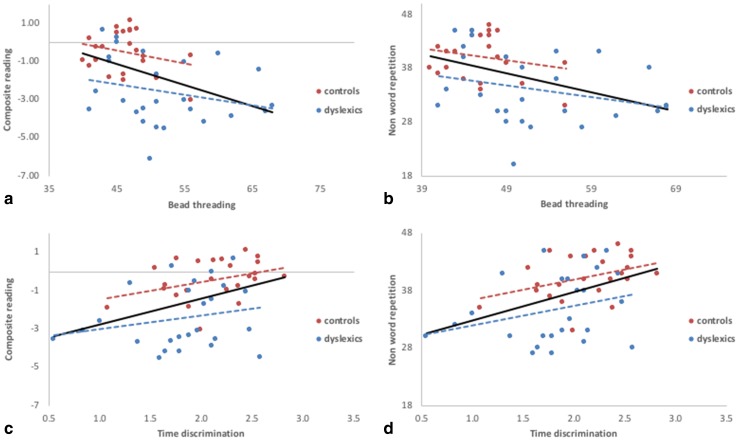
Fig. 3.
Relation between cerebellar function and literacy skills. Correlation between BT and CR (a), BT and NWRT (b), TD and CR (c), and TD and NWRT (d). Solid lines reflect significant correlations across both groups for all plots (a–d). Dashed lines show non-significant correlations within controls or dyslexics separately

