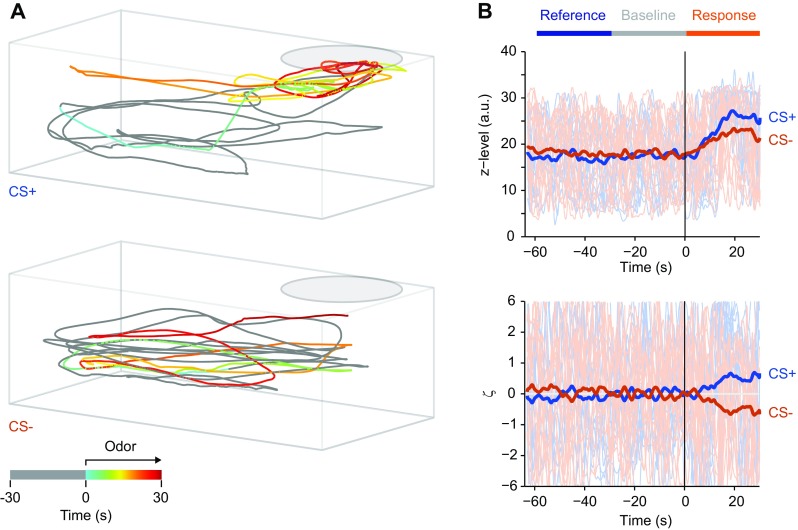
Fig. 2.

Analysis of behavior. a Examples of swimming trajectories prior to and during presentation of CS+ (top; Trp) and CS− (bottom; Ala) on day 5 of training. Each trajectory is 60 s long, comprising 30 s before and 30 s after odor onset, prior to food delivery. Time is color coded; pre-odor time is gray. b Top: time series showing one behavioral variable (z-level) as a function of time for all trials in an experiment; thick lines show averages. Odor was delivered at t = 0. Bottom: Same time series after transformation to ζ scores. Horizontal bars indicate reference, baseline and response time windows
