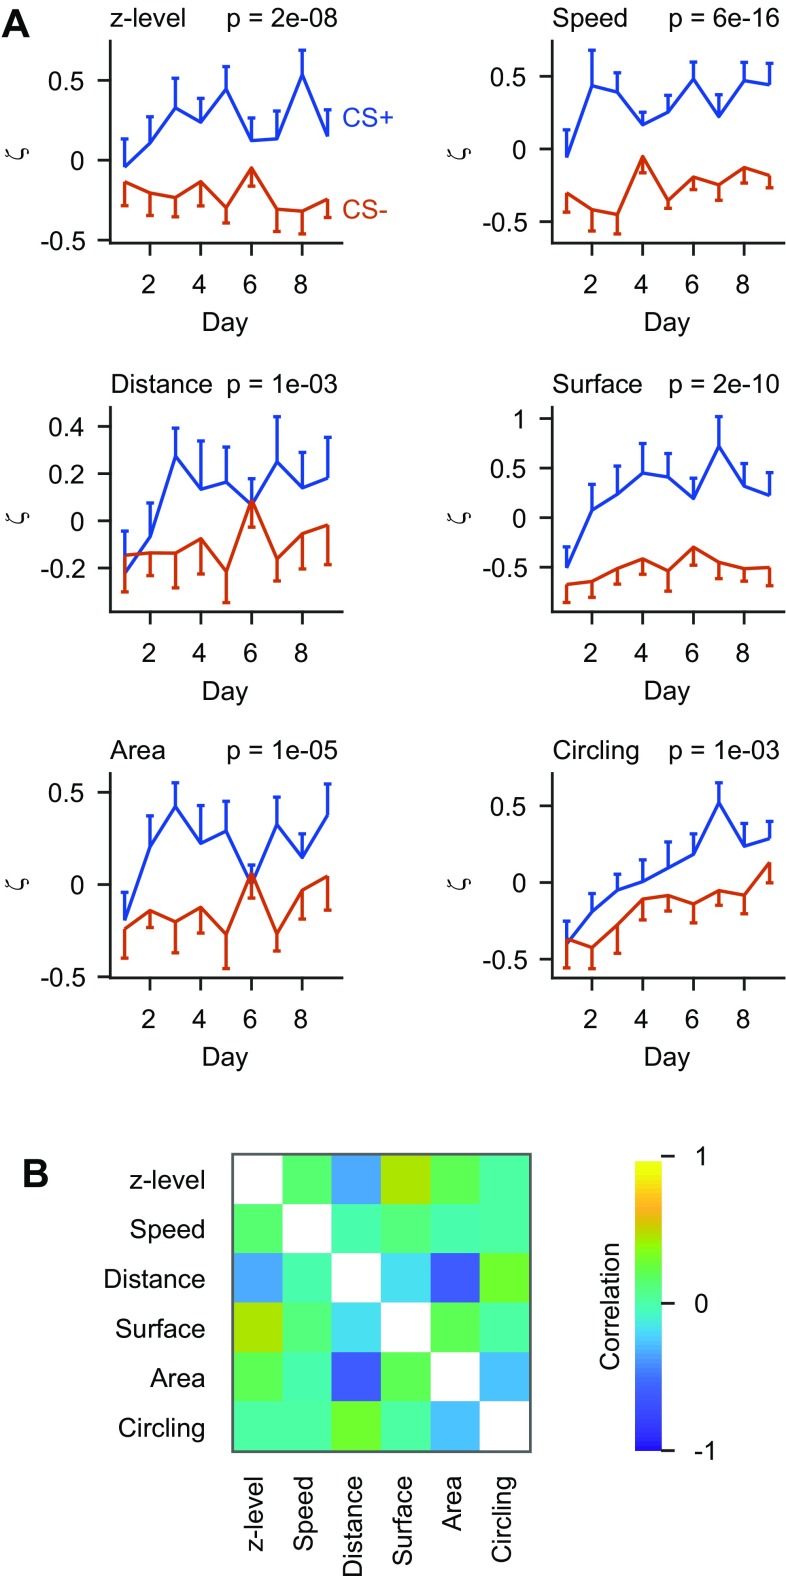
Fig. 3.
Analysis of discrimination learning. a ζ scores for the six behavioral parameters as a function of time, binned per day (medians) and averaged over fish (n = 12 fish). P values show that responses to CS+ and CS− were significantly different (Wilcoxon rank-sum test comparing all individual trials). Assignment of odor stimuli (Ala and Trp) as CS+ and CS− was varied between individuals. b Mean correlation between time series of ζ scores for different behavioral parameters (n = 62 fish from experiments 1–3). Correlations were calculated on a trial-by-trial basis for each fish and averaged over fish

