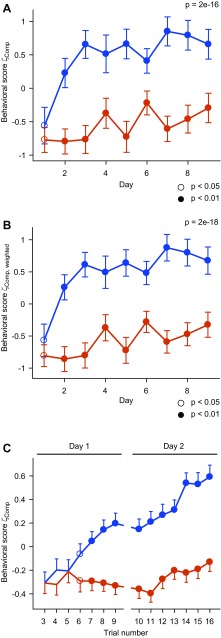
Fig. 4.
Discrimination learning curve. a Mean composite behavioral scores ζcomp for responses to the CS+ and CS− as a function of training days (experiment 1). Data points for each day show the median of nine trials, averaged over n = 12 fish. Error bars show SEM over fish. P value: Wilcoxon rank-sum test comparing all individual CS+ and CS− trials, pooled over all days. Circles depict significant differences between behavioral responses to the CS+ and CS− on each day (Wilcoxon rank-sum test comparing all individual trials on a given day). Open circles: 0.01 ≤ P < 0.05; filled circles: P < 0.01. Assignment of odor stimuli (Ala and Trp) as CS+ and CS− was varied between individuals. b Same as above for the combined behavioral score ζcomp,weighted, which weights individual ζ scores by their auto/cross-covariances. c Quantification of behavioral responses to the CS+ and CS− in successive trials during the first 2 days of training, averaged over all fish in experiments 1–3 (n = 62 fish; mean ± SEM). The first two trials and the last two trials were omitted because individual trial series of ζ scores were median filtered with window size five to minimize the potential impact of outliers. Open and filled circles depict significant differences between behavioral responses to the CS+ and CS− as in a. Assignment of odor stimuli (Ala and Trp) as CS+ and CS− was varied between individuals

