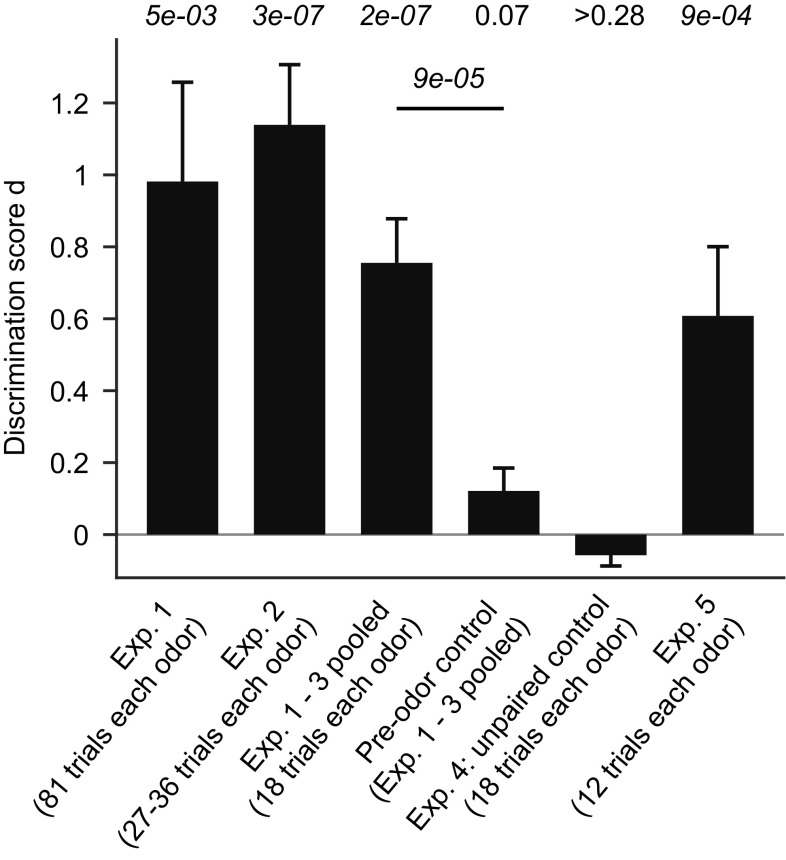
Fig. 5.
Quantification of discrimination behavior. Bars show the discrimination score d (mean ± SEM) obtained in different experiments. P values are from a Wilcoxon signed rank test comparing the observed discrimination score d against the null hypothesis that d = 0. Horizontal line shows statistical comparison between the discrimination score d obtained in pooled experiments 1–3 (first 18 trials only) and the d value of the corresponding pre-odor control (Wilcoxon rank-sum test)

