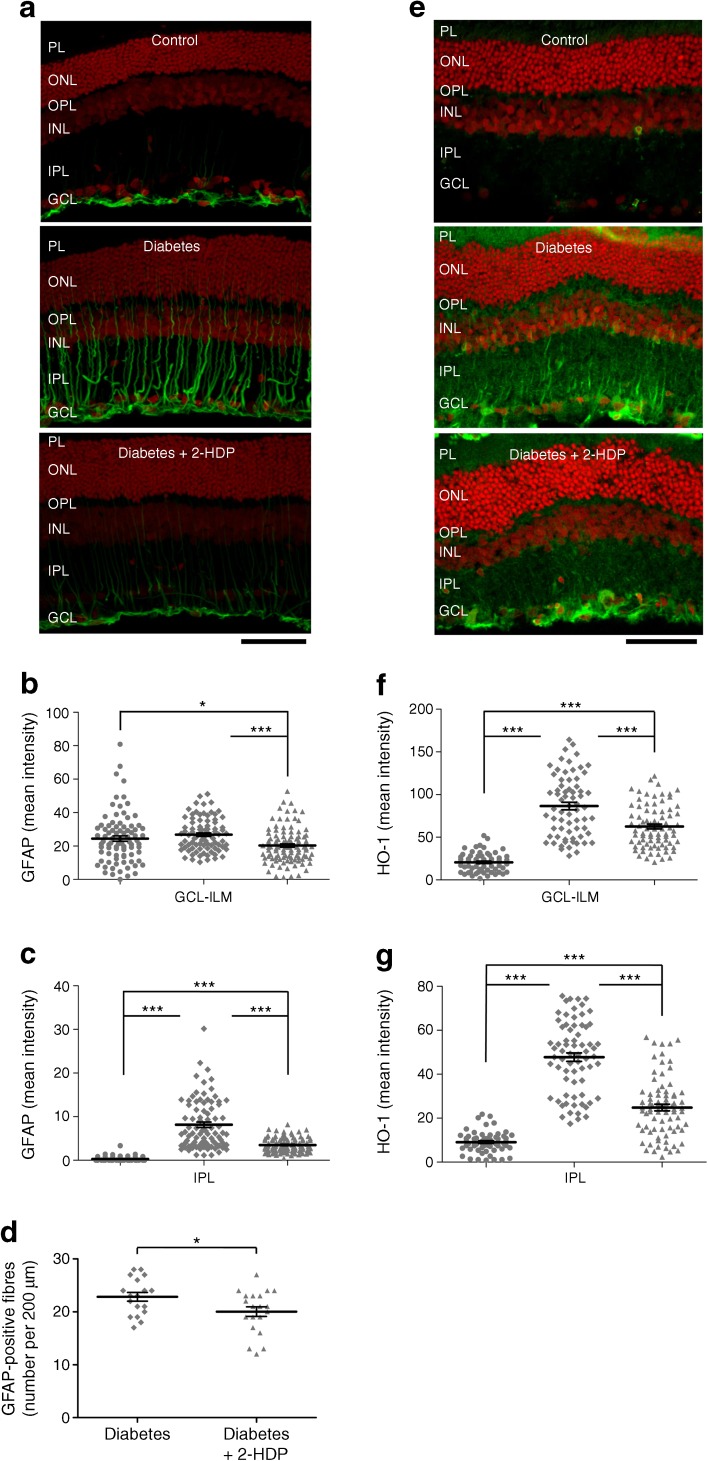
Fig. 3.
(a) GFAP immunolabelling (green) on retinal cross sections of control, diabetic and 2-HDP-treated diabetic animals; scale bar, 50 μm. Cell nuclei are counterstained with propidium iodide (red). (b, c) Column scatter graphs for the mean GFAP-staining intensity in regions of interest randomly selected within the ganglion cell layer-inner limiting membrane (b) and inner plexiform layer (c). Circles, control; diamonds, diabetes; triangles, diabetes + 2-HDP. (d) Column scatter graph showing the mean density of GFAP-labelled Müller cell fibres. n=6 retinas from six animals in each group. (e) Immunolabelling for HO-1 (green) in each of the three groups; scale bar, 50 μm. Cell nuclei are counterstained with propidium iodide (red). (f, g). Column scatter graphs for the mean HO-1-staining intensity in regions of interest randomly selected within the ganglion cell layer-inner limiting membrane (f) and inner plexiform layer (g). Circles, control; diamonds, diabetes; triangles, diabetes + 2-HDP; n=6 retinas from six animals in each group; a minimum of two and maximum of three retinal sections were analysed per animal. *p<0.05 and ***p<0.001 for the indicated comparisons. GCL, ganglion cell layer; ILM, inner limiting membrane; INL, inner nuclear layer; IPL, inner plexiform layer; ONL, outer nuclear layer; OPL, outer plexiform layer; PL photoreceptor layer

