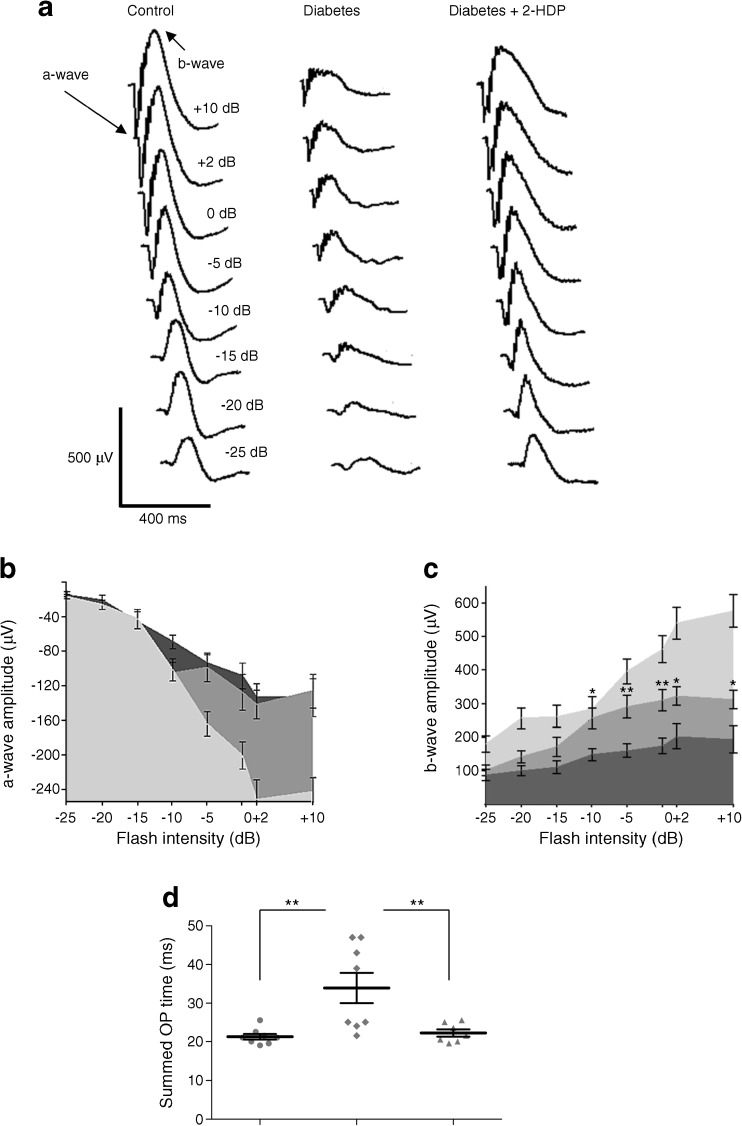
Fig. 7.
(a) Representative scotopic ERG waveforms at a range of stimulus intensities from −25 Db to +10 Db for a control, diabetic and 2-HDP-treated diabetic animal. The a- and b-waves are labelled for the control response elicited at +10 Db. (b, c) Summary data for a-wave (b) and b-wave (c) amplitudes for control (light grey), diabetic (dark grey) and diabetic animals treated with 2-HDP (medium grey). For clarity, only significant differences between diabetic and 2-HDP-treated diabetic animals are indicated (*p<0.05 and **p<0.01 vs diabetes alone). (d) Scatter plot showing data for summed oscillatory potential times (**p<0.01 for the indicated comparisons). n=8 animals in the control and diabetic groups and n=7 animals in the diabetic + 2-HDP group. OP, oscillatory potential

