Fig. 1.
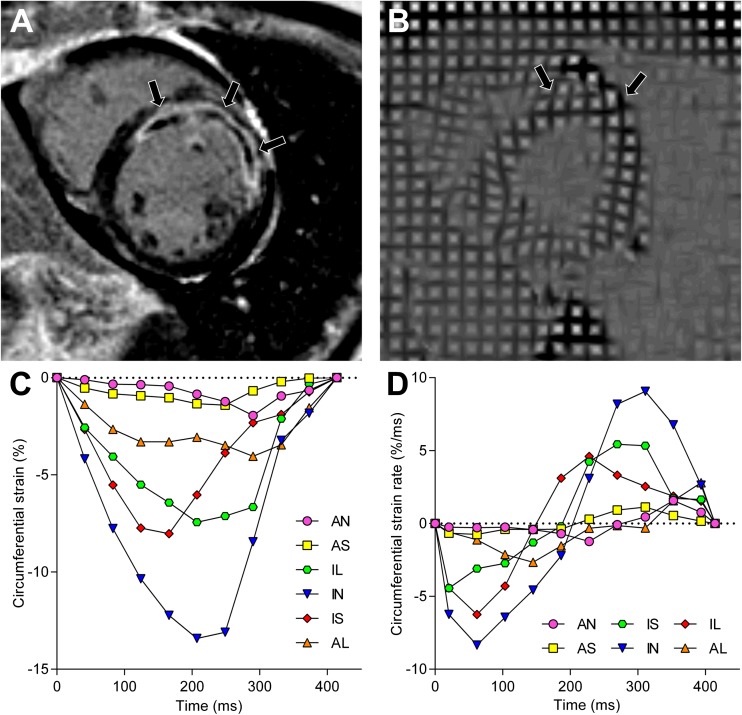
Example of strain and strain rate analysis in a patient after acute anterior myocardial infarction. Short-axis images (A and B) on identical locations 4 days after acute anterior myocardial infarction. The LGE image (A) demonstrates extensive hyperenhancement and MVO (arrows) of the anterior and anteroseptal wall. The end-systolic tagging image (B) shows limited deformation of the infarct zone (arrows), which is confirmed after strain analysis by a diminished peak circumferential strain (C) and reduced peak systolic and diastolic circumferential strain rates (D). AN = anterior, AS = anteroseptal, IS = inferoseptal, IN = inferior, IL = inferolateral, AL = anterolateral, MVO = microvascular obstruction

