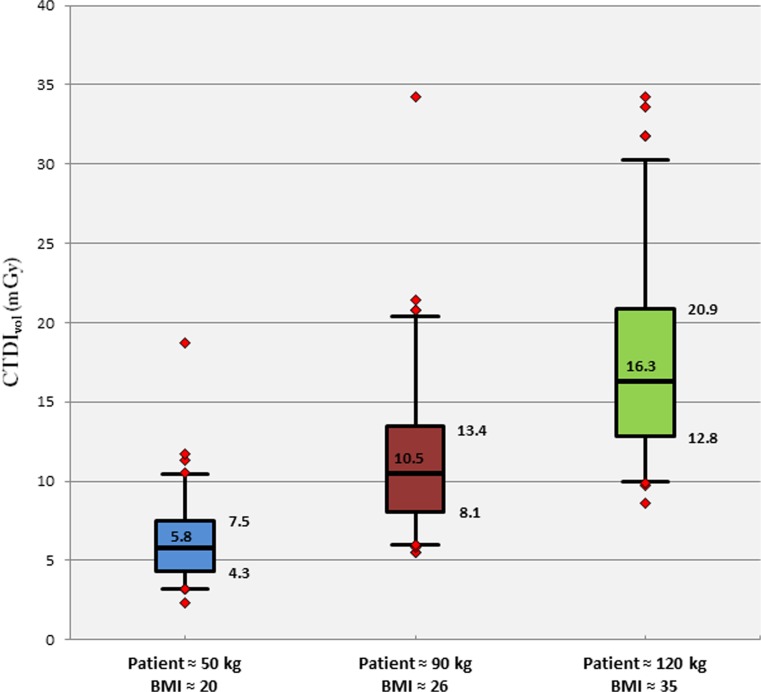
Fig. 2.
CTDIvol obtained for the three phantom sizes as a function of the abdominal clinical CT protocol settings. The black line in the middle of the coloured rectangles represents the median. The bottom edge of the rectangle corresponds to the first quartile and the top edge to the third quartile. The bottom line represents the fifth percentile and the top line the 95th percentile. The red dots outside these two lines are outliers

