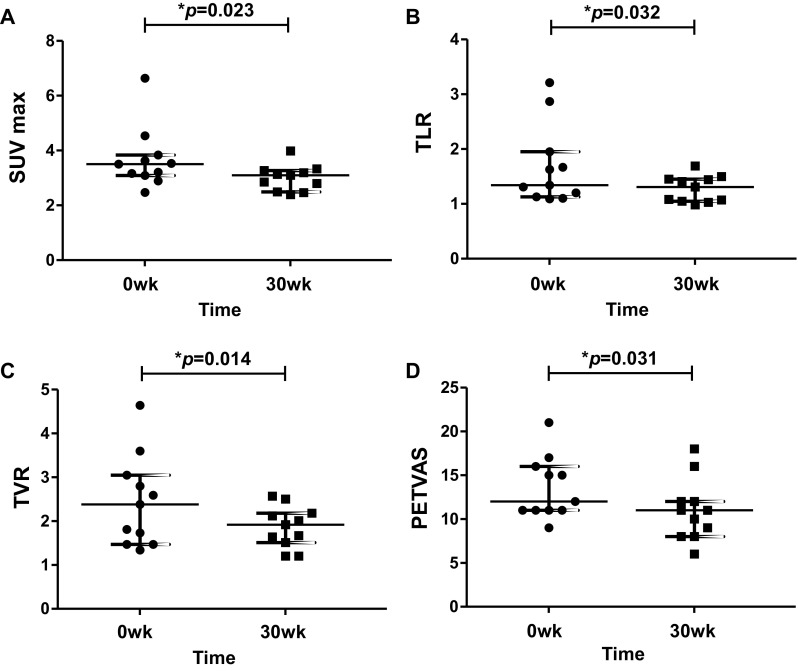
Fig. 4.

Measurement of 18F-FDG uptake on PET–CT before and after anti-TNF therapy in patients with Takayasu arteritis. Horizontal bars represent median and IQRs. a Changes from baseline in SUVmax values of 18F-FDG in arterial walls. b Changes from baseline in values of TVR defined as the ratio of SUVmax of a vascular ROI to the mean SUV of vein. c Changes from baseline in values of TLR defined as the ratio of SUVmax of a vascular ROI to the mean SUV of liver. d Changes from baseline in PETVAS, a summary score based on global arterial FDG uptake visually assessed in specified nine arterial territories (ascending, arch, descending thoracic and abdominal aorta, innominate, carotid, and subclavian arteries) using a 4-point scale. 18F-FDG 18F-fluorodeoxyglucose, PET–CT positron emission tomography–computed tomography, SUVmax maximum standardized uptake value, TVR target-to-vein ratio, ROI region of interest, TLR target-to-liver ratio, PETVAS PET vascular activity score
