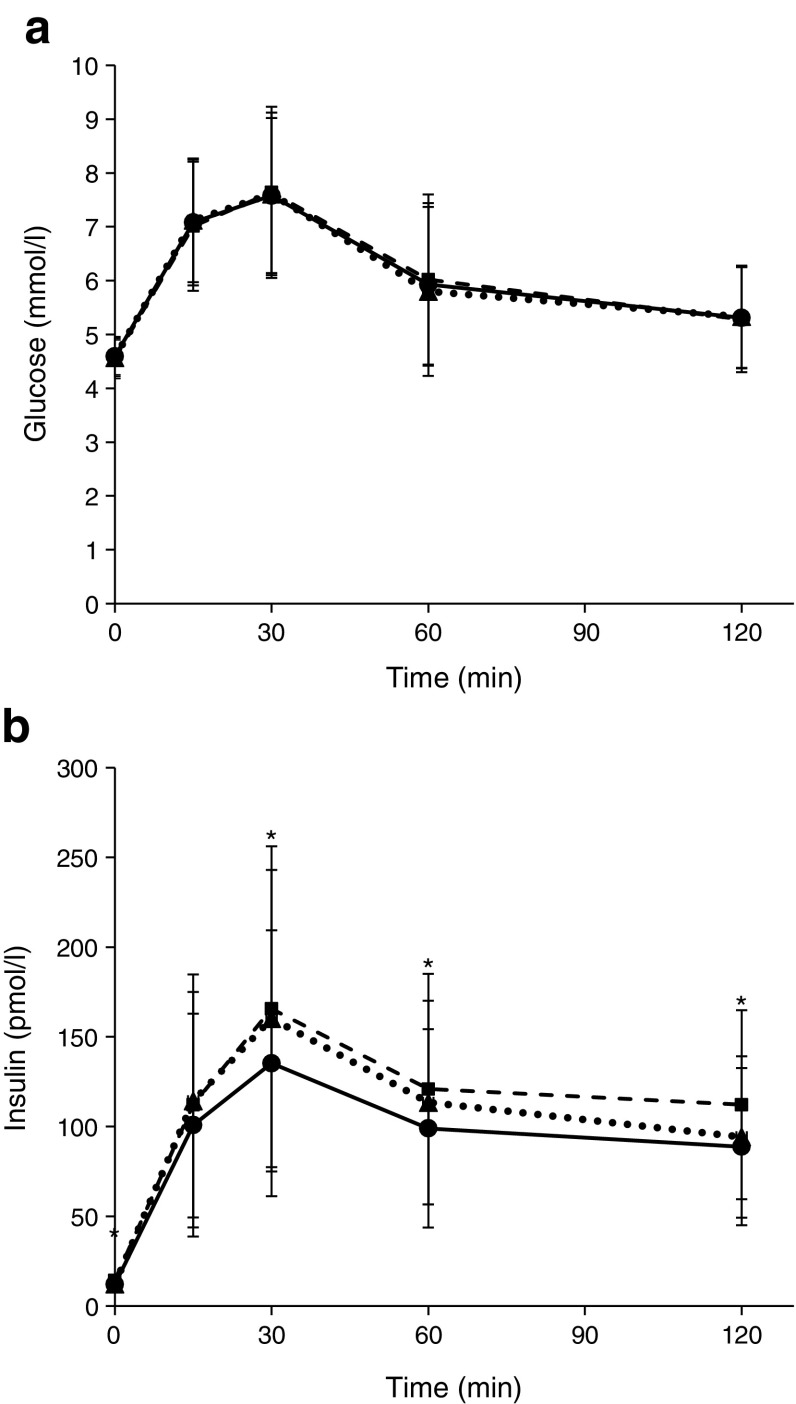
Fig. 1.
(a) Plasma glucose and (b) insulin concentrations at 0, 15, 30, 60 and 120 min during the OGTTs, stratified by IOM recommendations of GWG categories. Data are presented as mean ± SD and median ± absolute median deviation for glucose and insulin concentration, respectively, according to the time intervals. Black triangles with dotted line, group below recommendations; black circles with solid line, group within recommendations; black squares with dashed line, group exceeding recommendations. *p < 0.05 for the association across the IOM categories at each time point, with adjustments for children’s sex and age (ANOVA)

