
Fig. 2.
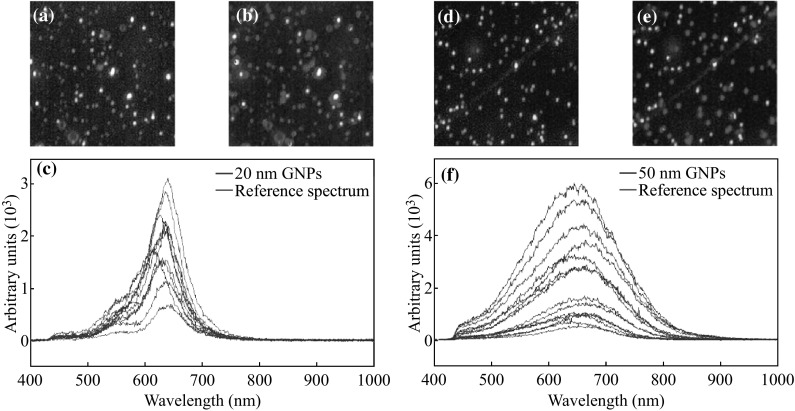
Characterization of GNPs. a, b, c The dark-field hyperspectral image, mapped image using the reference spectra marked in red in (c), and reflectance spectra of GNPs of size 20 nm, respectively. d, e, f The dark-field hyperspectral image, mapped image using the reference spectra marked in red in (f), and reflectance spectra of GNPs of size 50 nm, respectively. (Color figure online)