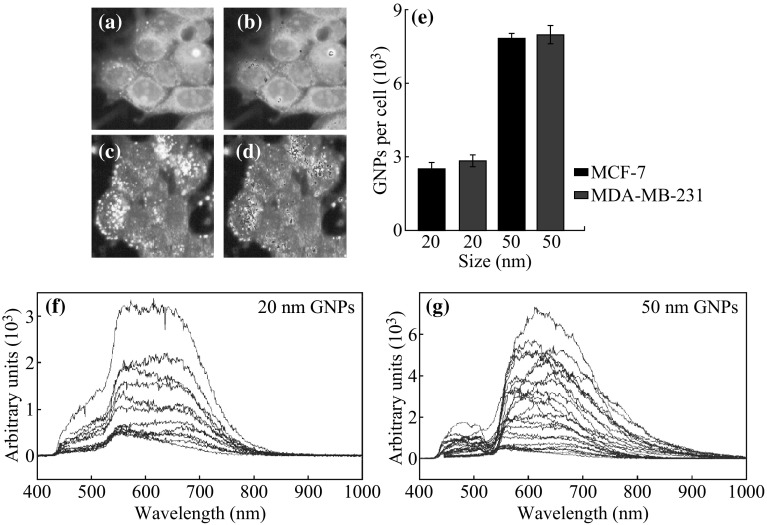
Fig. 4.
Monolayer uptake of GNPs. a The hyperspectral image of cells internalized with 20 nm sized GNPs. Bright dots represent GNP clusters localized within cells. b GNP clusters within the cells were mapped using one of the reflectance spectra of GNPs. c The hyperspectral image of cells internalized with 50 nm sized GNPs. Bright dots represent GNP clusters localized within cells. d GNP clusters within cells were mapped using the reflectance spectrum of GNPs. e The GNP uptake per cell for 20 and 50 nm GNPs across both cell lines. f, g The reflectance spectra for the 20 and 50 nm GNPs in the monolayer cell samples are shown in (a, c)

