Fig. 2.

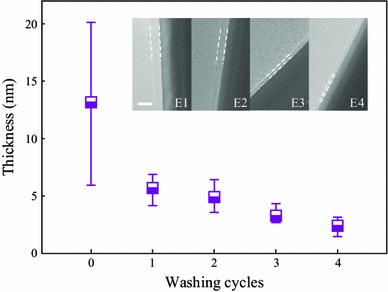
Average thickness distribution of PVP nanolayer.Inset: TEM images of AgNWs washed with ethanol for different cycles. Scale bar = 10 nm

Average thickness distribution of PVP nanolayer.Inset: TEM images of AgNWs washed with ethanol for different cycles. Scale bar = 10 nm