Fig. 3.
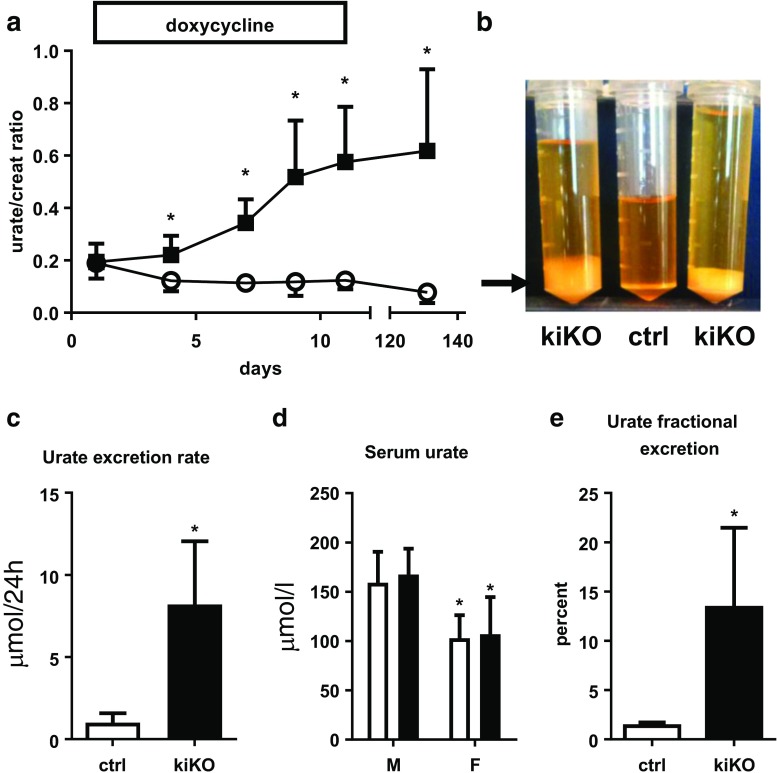
Doxycycline-induced deletion of GLUT9 in the kidney: functional analysis. a Time-course of the urate/creatinine ratio from spot urine after doxycycline induction (starting at day 0). Four days after the induction, the urate/creatinine ratio is significantly increased in kiKO mice compared to control. Four months after the induction by the doxycycline, the difference between control and kiKO mice is still present. Values are means ± SD (n = 6, *p < 0.05 by Student’s t test). b Twenty-four-hour urine collection of kiKO mice presents an important white deposit (arrow) when kept at room temperature. This deposit is made of uric acid crystals (not shown) and is absent in control urine. The 24-h volume of kiKO mice urine is higher than the volume of control urine and accordingly, urine is more diluted. c Measurement of 24-h urate excretion rate. Urate excretion rate for kiKO mice is higher than for controls. Values are means ± SD (n = 8, *p < 0.05). d SUA analysis. There is no difference between control (white bars) and kiKO (black bars) mice regarding plasma concentration of urate. Males had higher urate concentration in the plasma than females. Values are means ± SD (n = 8, *p < 0.05). e Fractional excretion of urate (FE urate). A significantly higher FE urate was measured in kiKO mice compared to controls. Values are means ± SD (n = 8, *p < 0.05)

