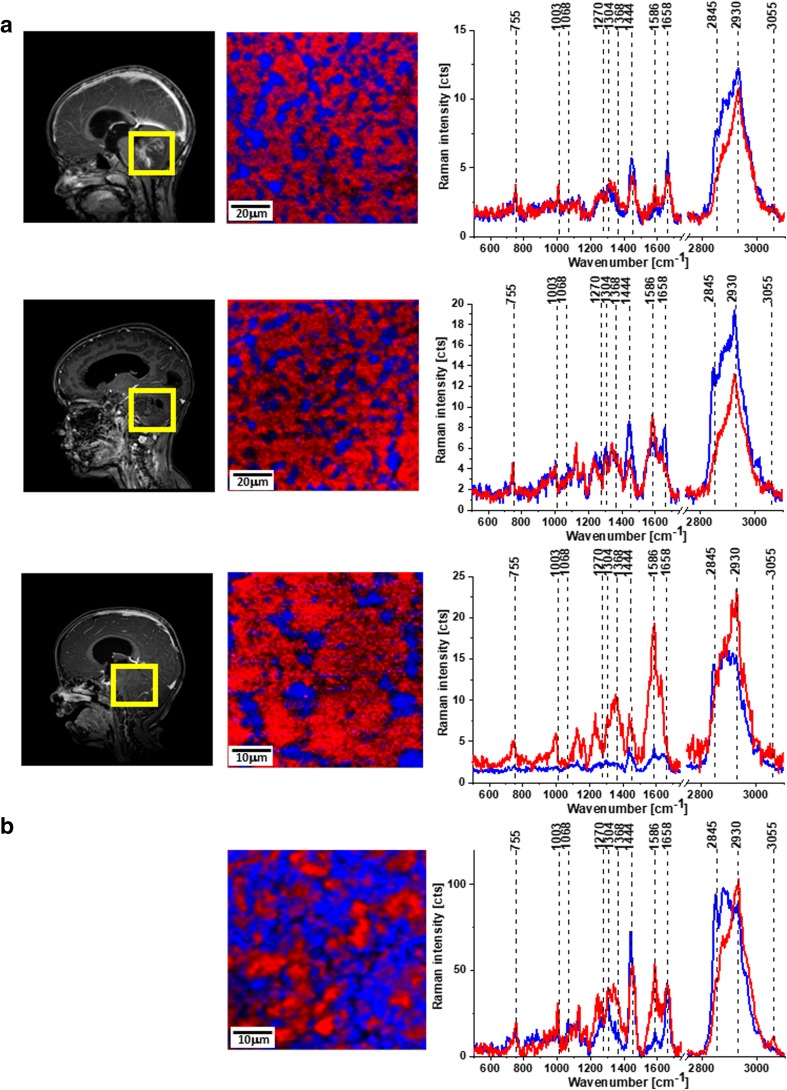
Fig. 1.
MRI images, Raman images, and Raman spectra of medulloblastoma (P27, P34, P38) (A) and Raman image and Raman spectra of normal tissue (B). The line colors of the spectra correspond to the colors of the Raman maps. Integration time for images, 0.5 s; resolution step, 0.5 μm; laser excitation power, 10 mW

