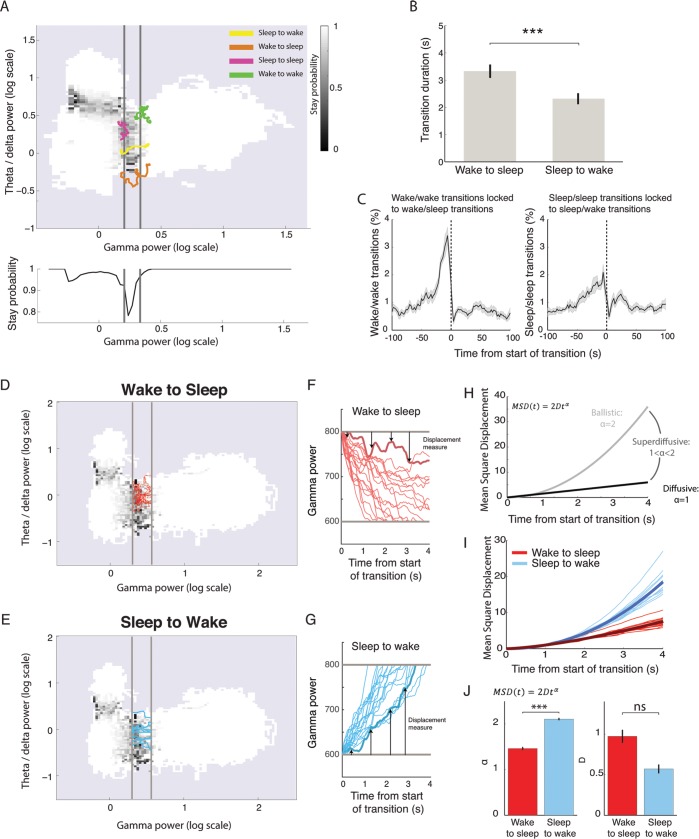
Fig 7. Analysis of phase space trajectories to study the dynamics of state transitions.
(A) Phase space map of the stay probability, i.e., the probability of remaining in the current state after 3 s. Far from state boundaries, stay probability equals 1 (white), indicating that this part of the phase space is highly stable; the frontiers between states are characterised by low stay probability (black). Averaging the stay probability along the gamma power axis (bottom panel) reveals a strong dip in stay probability that is identified as the transition zone between sleep and wake (grey lines). Trajectories around the transition border illustrate full transitions (sleep to wake and wake to sleep) and aborted transitions (sleep to sleep and wake to wake). (B) Traversal time of the transition zone showing that wake-to-sleep transitions are significantly longer than sleep-to-wake transitions (paired t test: p = 0.0007, n = 15; error bars: s.e.m.; *** p < 0.001). (C) Cross-correlation of aborted transitions’ times relative to true transitions. Wake-to-sleep transitions are more tightly coupled to aborted transitions from wake than sleep-to-wake transitions to aborted transitions from sleep (error bars: s.e.m.). (D, E) Phase space of stay probability with transition zones shown in grey with 10 randomly chose transition trajectories from wake to sleep (D) or from sleep to wake (E). (F, G) Gamma power as a function of time for wake-to-sleep (F) and sleep-to-wake (G) trajectories. Arrows show how displacement is measured for the trajectory shown in thicker line: at each time point, the distance to the transition zone is calculated. The square of this value yields the MSD. (H) Theoretical relationship between MSD and time for three regimes of motion: ballistic, superdiffusive, and diffusive. (I) MSD for sleep-to-wake and wake-to-sleep trajectories as a function of time after normalisation by D for clarity. Thick line: average over all mice (n = 15). Note the clear separation of the two sets of lines. (J) Values of alpha and D obtained after fitting the MSD curves (F). Note that alpha is significantly increased for sleep-to-wake transitions relative to wake-to-sleep transitions. (paired t test: alpha: p = 7E-11, D: p = 0.2, n = 15, *** p < 0.001). MSD, mean square displacement; ns, not significant.

