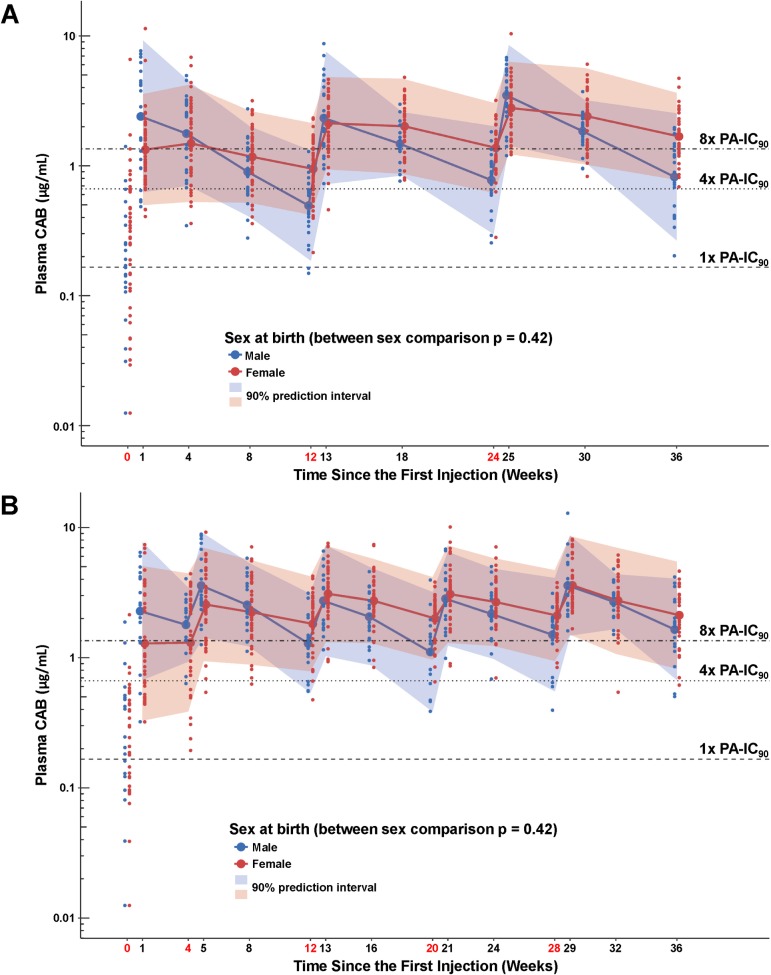
Fig 5. CAB concentrations by sex at birth and cohort.
(A) Cohort 1 plasma CAB concentrations by sex at birth. (B) Cohort 2 plasma CAB concentrations by sex at birth. Shaded areas represent the 90% prediction interval for the model. Time points indicated in red denote visits at which injections were administered. Time 0 values represent plasma levels 1 week after last oral CAB dosing. PA-IC90 is the protein-adjusted concentration at which 90% inhibition of viral replication is achieved. CAB, cabotegravir.

