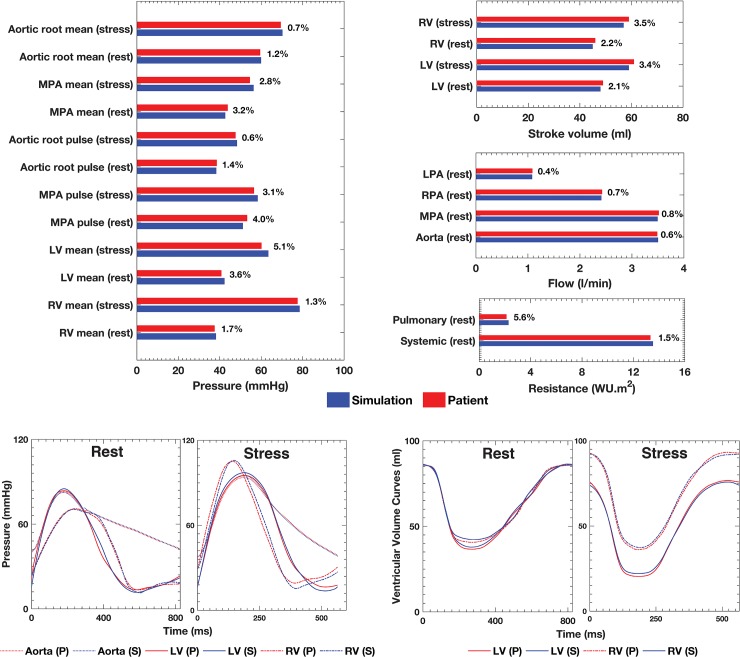
Fig 2. Relative error between patient and simulation data given as a percentage.
Bar plots comparing the clinical pressure and flow at relevant anatomic landmarks, and ventricular stroke volume and systemic and pulmonary vascular resistance data at Rest and Stress, and corresponding simulation results. Selected pressures and ventricular volumes transient waveforms corresponding to the cycle-to-cycle equilibrium for the Rest and Stress Conditions are also show. P, patient clinical data. S, simulation results.

