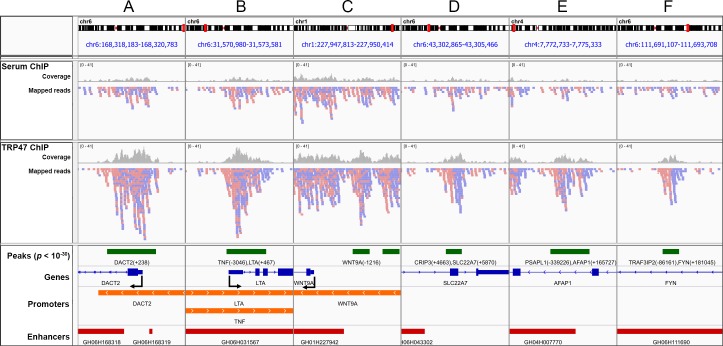
Fig 5. Visualization of E. chaffeensis TRP47 binding sites in genome browser.
IGV was used to visualize TRP47 binding peaks in gene promoter and enhancer regions. Panels A-F represent genomic locations containing highly significant (p < 10−30) peaks. Serum and TRP47 ChIP tracks show forward (red) and reverse (blue) strand mapped reads and read coverage (gray bars). The tracks below depict peaks (green rectangles) labeled with associated genes and distance from TSS in parentheses; genes as exons (blue rectangles) and introns (blue lines) including 5' to 3' direction (blue arrows) and TSS (bent arrows); promoters (orange rectangles), specifically regions -5 kb to +1 kb from EPDnew primary promoter TSSs; and enhancers (red rectangles) labeled by GeneHancer ID number.

